Run the Clinical Quality Measures Report
The Clinical Quality Measures report in PCC EHR calculates your clinicians’ performance on CMS Clinical Quality Measures.
Follow the procedure below to use the report.
More About PCMH, CQMs, Meaningful Use Measures and Incentive Programs: For more information, check out the PCMH, CQMs, Measures, and Incentive Programs section of PCC Learn.
CQM Criteria Have Changed: Criteria and qualifying procedures for CQMs have changed. This report is still a useful way to measure how your practice addresses these measures:
• Children Who Have Dental Decay or Cavities
• Appropriate Testing for Children with Pharyngitis
• Chlamydia Screening for Women
• Weight Assessment and Counseling for Nutrition and Physical Activity for Children and Adolescents
For other CQMs, you should review your activity in the Practice Vitals Dashboard, order reports in the PCC EHR Report Library, or use another method.
Configure Your System and Adjust Chart Policies
The Clinical Quality Measures report depends on charting and coding in PCC EHR. You may need to adjust how you code and chart visits in order for PCC EHR to properly evaluate your CQM percentages.
Read Clinical Quality Measures with PCC EHR to learn more.
Time Period: After your practice makes configuration and workflow changes, you may need to wait 90 days in order for the Clinical Quality Measures report to fully reflect how your office addresses each measure.
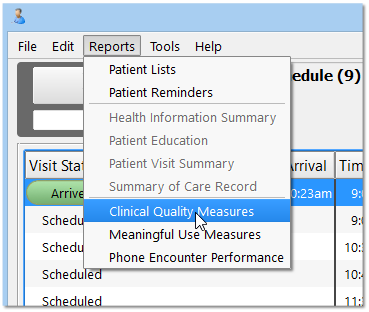
Click “Reports” and Select “Clinical Quality Measures”
The Clinical Quality Measures report is in the Reports menu.
Select Measures, Reporting Period, Eligible Professionals, and Report Layout
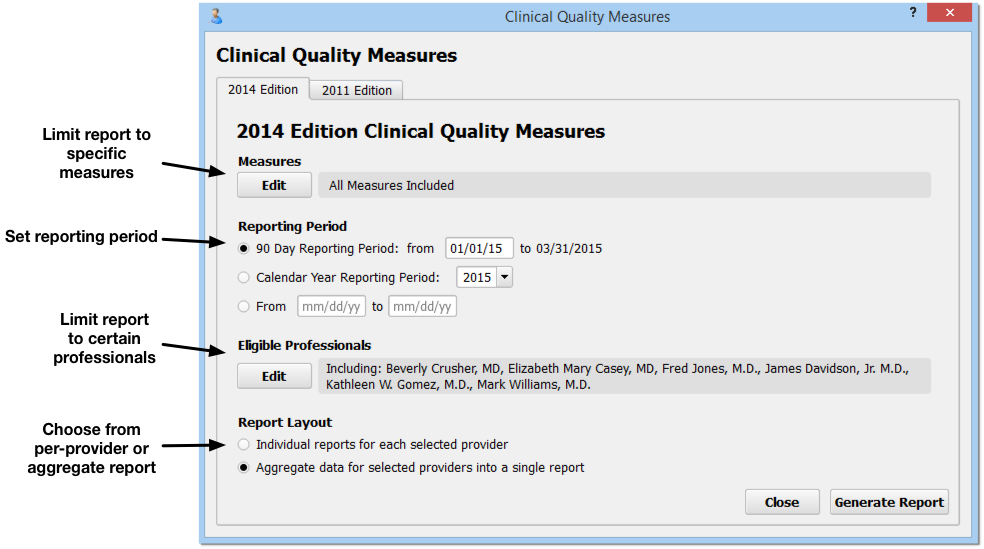
On the Clinical Quality Measures report criteria screen, you can adjust options for output before you generate the report.
-
2014 or 2011 Edition: You can select either the 2014 or 2011 Edition CQM rules by clicking on a tab at the top of the screen. Note that the 2011 CQM rules have been retired and that practices can no longer apply for the EHR Medicaid Incentive Program or for PCMH recognition using the 2011 rules.
-
Limit Measures: By default, the Clinical Quality Measures report will evaluate your practice’s data for the nine CMS recommended pediatric CQMs. You can click “Edit” in the Measures criteria section to limit measures that will appear on the report. These nine measures are appropriate for both the EHR Medicaid Incentive program and for PCMH applications.
-
Reporting Period: For 2015, your EHR Medicaid Incentive Program application or PCMH application will probably use a 90-day reporting period. For 2016 and beyond, a full calendar year may be required. You can set any 90-day period, any calendar year, or input a custom reporting period.
- Do not use a reporting period that extends before the date you went live with PCC EHR. Some of the data needed to properly calculate CQMs can not be obtained through data conversions.
- If you have added chart note components or made charting policy changes at your practice in order to record data for CQMs, you should use a reporting period after you made those changes.
-
Eligible Professionals: Click “Edit” in the Eligible Professionals criteria section to select providers for the report. For example, for the EHR Medicaid Incentive Program, you will run reports for professionals that perform at least 20% Medicaid visits. Contact PCC Support for help determining the Medicaid volume of the clinicians at your practice. For PCMH, you should select all providers (NP, PA, MD, DOs, etc.) However, for both PCMH and EHR Medicaid Incentive Program applications, you should use this criteria to exclude generic or “nurse” provider entries.
-
Report Layout: The EHR Medicaid Incentive program application requires data for each eligible professional. A PCMH recognition application requires a practice aggregate report.
Once you set the report criteria and generate the report, PCC will remember your settings and restore them each time you open the Clinical Quality Measures Report.
Who Did What in PCC EHR?: As you review data for each eligible professional, keep in mind that 2014 Clinical Quality Measure calculations use the “Provider of Encounter” for each visit. The PoE appears at the top of each chart note, and by default is the scheduled provider. 2011 calculations were based on the clinician who signed the visit.
Click “Generate Report”
After you make your selections, click “Generate Report”.
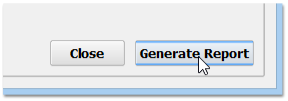

The Clinical Quality Measures report examines details from hundreds or thousands of charts and may take several minutes to run. You may prefer to run it after-hours, when your system is less busy.
Review Report Results
The Clinical Quality Measures report will calculate and display your practice’s numbers for each measure, either as an aggregate report or per-provider.
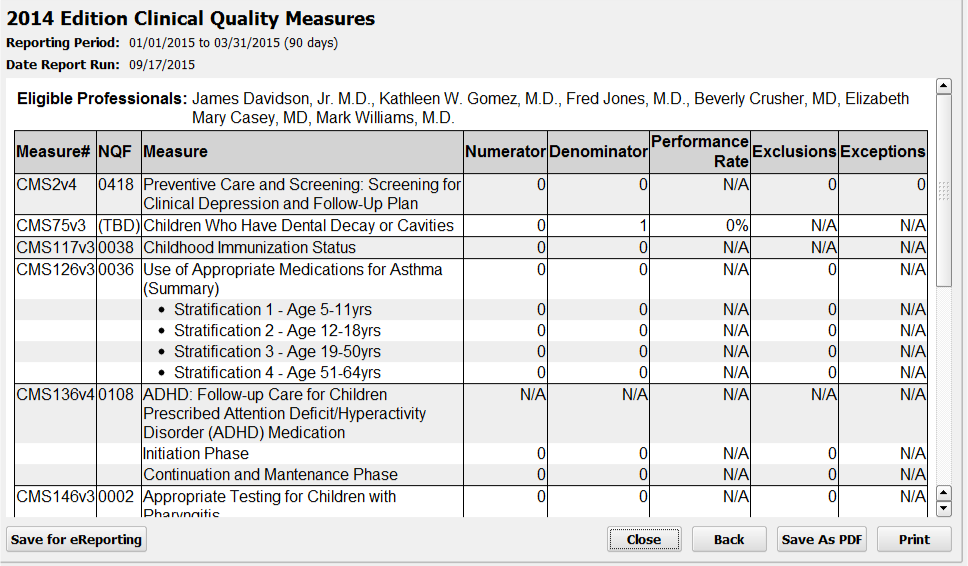
For each Clinical Quality Measure, you can see the CMS and NQF code, a description of the measure and any components that make up the measure, followed by your practice’s results.
-
Numerator and Denominator: Most CQM results display a number of patients who meet the requirements or goal of the measure (the “Numerator” column), as well as the total number of patients who were billed a visit code during the reporting period (the “Denominator” column).
-
Performance Rate: Next, the “Performance Rate” column displays your practice’s percentage for the measure, calculated by dividing the numerator by the denominator.
-
Exclusions or Exceptions: The final two columns display the total number of any patients who met certain CQM-specific exclusions or exceptions. For example, if a patient was pregnant during the reporting period, they will show up in the Denominator but appear in the Exclusions column instead of the Numerator for the Weight Assessment CQM.
Interpreting Your Results: The philosophical goal of Clinical Quality Measures is to improve them over time. A low score or a zero score does not indicate that your practice or an eligible professional have failed to meet the measure–there is no success threshold. A higher percentage may mean that your practice is doing better at meeting the goals of the measure, but an improved percentage over time is the true goal. One exception to the “higher is better” rule is the “Children Who Have Dental Decay or Cavities” measure, for which a smaller percentage is desirable.
How Do I Chart and Configure PCC EHR to Affect Each Line? How Is Each Line Calculated? What Are the Exceptions and Exclusions?: Clinical Quality Measures compare activity during a visit, including how medical issues are recorded in a chart note, patient prescriptions, etc., with the diagnoses and procedures you record for a visit. For more information on how each line of the Clinical Quality Measure report is calculated, and to learn what changes you can make in your PCC workflow to improve your percentile score, read the Clinical Quality Measures in PCC EHR article.
Optional: Drill-Down to Per-Patient Details
Click “Details” for any measure to review patient-level details for the results.
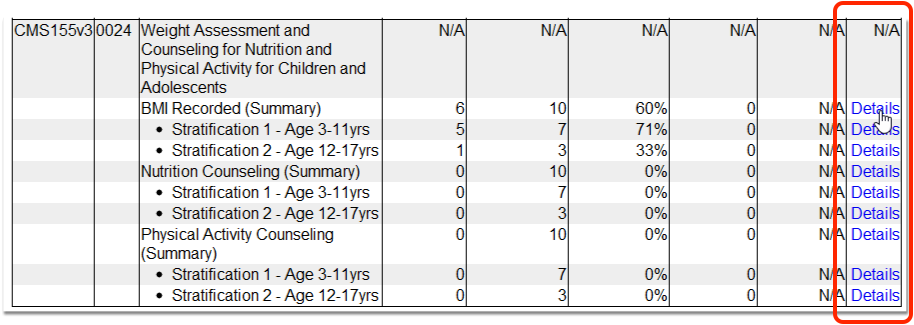
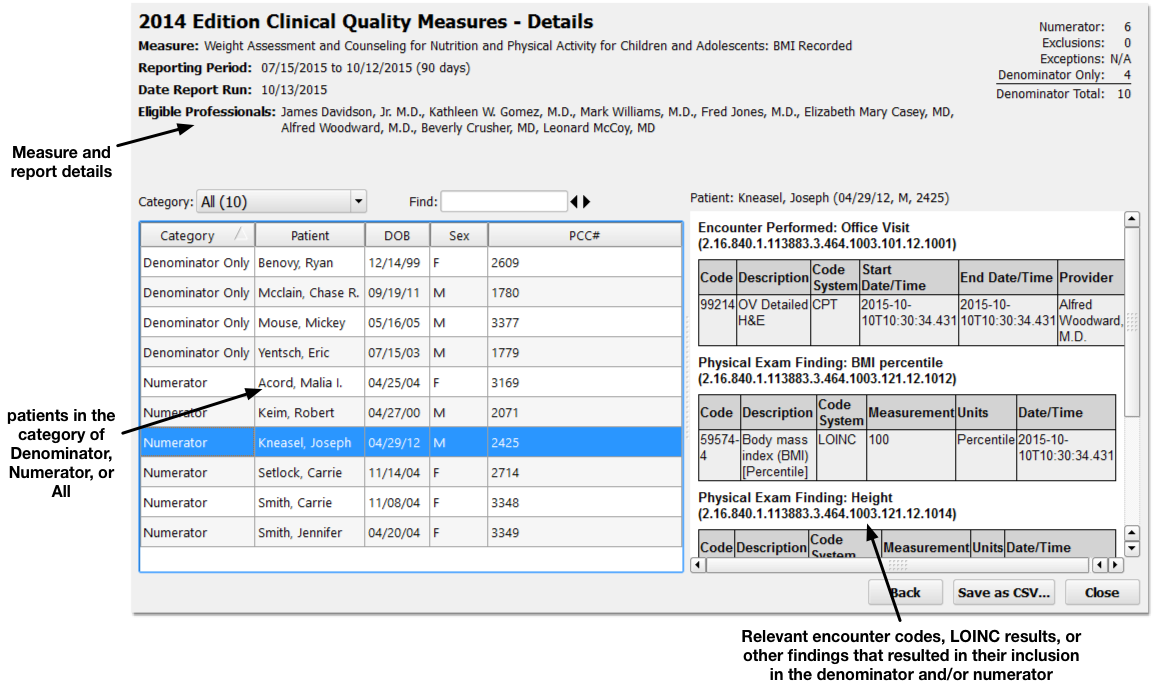
Details for the report and the selected measure appear at the top. On the left, you can specify what portion of the patient population you wish to review (Numerator, Denominator, or All patients).
Click on any patient on the left to review what occurred for them to be counted in the denominator or the numerator on the right.
By reviewing patient records to see why they were or were not included in a measure’s calculation, you can address potential problems in your patient workflow or PCC configuration that may alter your final percentage.
Optional: Output the Report
Click “Save as PDF” or “Print” to output a copy of the CQM results.
What is eReporting?: Click “eReporting” to create a digital file containing your CQM results in QRDA Category 3 format. Some agencies may support uploading results so you do not have to retype them in order to apply for an incentive program. This feature is in pilot testing. Please consult PCC Support if you’d like to try this feature.
