Report on Clinical Quality Measures
The Clinical Quality Measure reports in the Report Library calculate your practice’s performance on some of NCQA’s PCMH standardized measures. To explore PCC’s resources for PCMH certification, check out our PCMH, CQMs, Measures, and Incentive Program resources. To find out more about PCMH measures and standards, visit the NCQA’s PCMH Standardized Measurements site.
Run a Clinical Quality Measure Report in the Report Library
When you are ready to run CQM reports for your practice follow the procedure below.
Configure Your System and Adjust Charting Workflows
The Report Library’s Clinical Quality Measures reports depend on charting and coding in PCC EHR. You may need to adjust how you configure, code and chart visits in order for PCC EHR to properly evaluate your CQM percentages.
Configuration may include mapping LOINC and SNOMED codes to orders, adding follow-up orders or one-click immunization orders to protocols, and making sure that specific orders are configured to support positive or negative results.
Read How to Chart for Each Clinical Quality Measure to learn more.
Configuration Improves Future Measures: Any configuration changes that your practice makes will affect future measures, but will not affect measure results prior to the configuration change. For example, attributing a SNOMED or LOINC code to an order does not attribute those codes to past instances of the order.
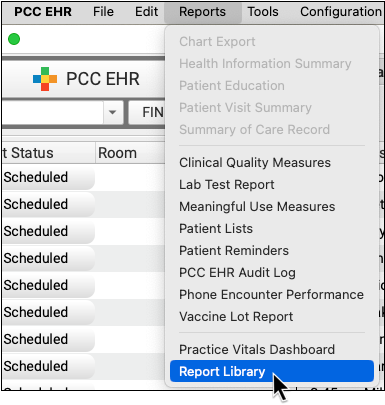
Open the Report Library
Open Reports menu and select “Report Library”.
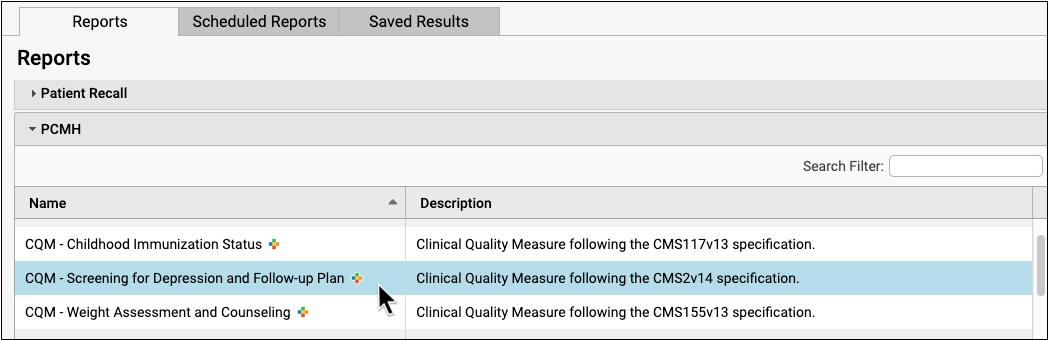
Open a Clinical Quality Measure Report
Select one of the Clinical Quality Measure reports available in the PCMH category.
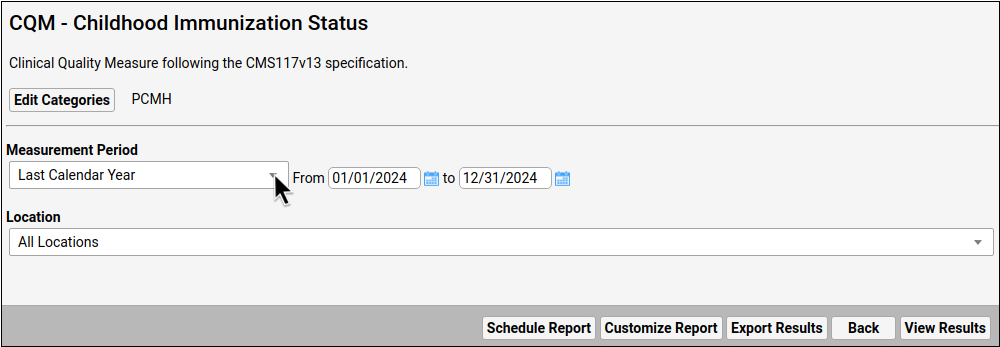
Select Your Criteria
Select the measurement period for your report output.
Which Location?: As you review measure results for each location, keep in mind that Clinical Quality Measure calculations attribute patients to the location of their most recent eligible encounter during the selected reporting period. This is the location that appears at the top of each chart note, and is the location of the scheduled encounter.
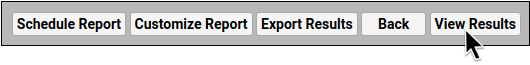
Click “View Results”
To see the report output, click “View Results”.
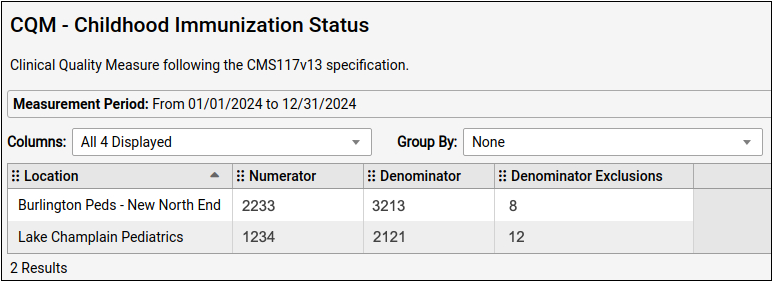
Review Report Results
The Clinical Quality Measure reports calculate and display your practice’s numbers for each measure as an aggregate total in the numerator and denominator columns, as well as exclusion and exception columns (if applicable).
-
Numerator: The Numerator column typically displays the number of patients who meet the requirements or goal of the measure. Patients are only counted once within a practice, even if they are seen at different locations during the reporting period. Some measures count encounters instead of patients.
-
Denominator: The Denominator column represents the Initial Population for a given measure. This is typically the number of patients of a specified age who were billed with a visit code during the reporting period. Some measures count encounters instead of patients.
-
Location: Patients are attributed to the location of their most recent eligible encounter during the selected reporting period. Telemedicine is counted as a separate location that can be tallied and added to the total manually.
-
Exclusions and/or Exceptions: The final columns display the total number of any patients who met certain CQM-specific exclusions or exceptions, typically based on diagnosis.
Low or Zero Score: Clinical Quality Measures compare activity during a visit (how medical issues are recorded in a chart note, patient prescriptions, etc.) with the diagnoses and procedures recorded for the visit. A low score or a zero score may not indicate failure to meet the measure. Make sure that the orders and screenings related to each measure are configured appropriately in the Component Builder. Unfortunately, any new configuration only affects future reporting, and does not update CQM measure results retroactively. For more information on how each of the Clinical Quality Measure reports are calculated, and to learn what changes you can make in your PCC workflow to improve your percentile score, read the How to Chart for Each Clinical Quality Measure article.
Calculate Percentages
Use the numerator, denominator, and exclusions, in the report to calculate your percentages. Subtract all exclusions and exceptions from the denominator before dividing the numerator by the denominator and multiplying by 100 to get your percentage for reporting.
- Final Denominator = Denominator – (Exclusions + Exceptions)
- (Numerator/Final Denominator) x 100 = Percentage for Reporting
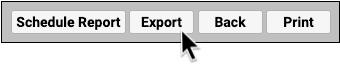
Optionally Export or Print the Report
Click “Export” to export a PDF or CSV copy of the report. Click “Print” to print a copy of the report.