Financial Reports in Practice Management
The Practice Management (Partner) tool in PCC EHR includes a wide array of financial reports. While many of these functions have been replaced with PCC EHR tools with modern interfaces, there are still many powerful, customizable reports that can help you track charges and payments and report on your practice’s overall financial health.
Get the Report You Need: As you browse the lists of reports below, remember that PCC EHR and the Practice Management tools can produce custom reports to your specifications. If you do not find what you are looking for, contact PCC Support for help creating a report with the information your office needs.
Contents
Day-to-Day Workflow
These reports help you see the trees and not just the forest. Billers use these reports to track down outstanding balances, deal with EDI submissions, and perform other daily functions or tasks.
Single Account
The reports below help you research the current financial situation and review account history for a particular account.
coll-
The Collection Report (
coll) shows detailed information about outstanding charges for a single account. Basic demographic information and payments for any date range are also available in the report. When you need to understand why an account owes money,collis the best tool.collcan also display all payments from a family during a certain time period, such as a full tax year.To run
coll, first run the Family Editor (fame) for an account and then press F3 – Collection Report. dsscan-
The Daysheet Scan (
dsscan) lets you view alldaysheetentries for one particular account. You can see every charge, payment, or adjustment that was posted or deleted on the account, along with the user who performed the action.dsscanis useful when a charge is posted by one user and deleted by another user, or when the account or deposit report is difficult to understand.The
dsscanreport is located in the Proving Out window, within the Billing Functions window of Practice Management. tater-
The Account History Report (
tater) provides a complete history of all transactions on an account.taterreports on all charges, payments, refunds, and other transactions. Usetaterto track a running balance or produce a detailed financial report on a family.To run
tater, first run the Family Editor (fame) for an account and then press F8 – Account History.
Daily Billing and Collections Work
The reports below are everyday tools for your practice’s biller. They will help you track charges and work down your accounts receivable.
ecsreports-
The
ecsreportsprogram displays electronic claim submission reports, ebills reports, and electronic remittance advice (ERAs). The program displays incoming reports by date and includes a category view and various search features for finding and working with old reports. Runecsreportswhen you need to find out why a claim was rejected or need proof of timely filing.The
ecsreportsprogram is located in the Insurance Collections window within the Billing Functions window of the Practice Management windows. inscoar-
The Insurance Accounts Receivable Detail (
inscoar) report provides a detailed, charge-by-charge accounts receivable report for your insurance companies. Useinscoarto find unpaid insurance charges and to work on old, overdue charges. You can also runinscoarinteractively, allowing you to jump into different programs and research or modify charge information while viewing the report.The
inscoarreport is located in the Insurance Collections window within the Billing Functions window of Practice Management. persview-
The Personal Money Tracking Assistant (
persview) is an interactive report for managing accounts with outstanding personal balances. Usepersviewto manage personal billing. You can limitpersviewto show families that are extremely overdue or who owe more than a specific amount. Frompersview‘s output, you can mail bills or form letters for one or many accounts. You can also jump directly into other programs for more information about an account on the report.The
persviewreport is located in the Personal Billing and Collections window within the Billing Functions window of Practice Management. openpmts-
The Open/Unlinked Payments (
openpmts) report lists credits and payments that are not linked to a specific charge. PCC automatically applies unlinked payments towards each account’s balance, but payments are difficult to locate or understand if they are not linked.openpmtscan be subtotaled in various ways to help you clean up accounts with unlinked payments.The
openpmtsreport is located in the Payments/Refunds window within the Billing Functions window of Practice Management. srs: Billing Report by Family-
The Billing Report by Family, located in the Billing and Collection section of the Smart Report Suite (
srs), will help you find personal or insurance bills that have been billed multiple times. You can use the report to create a list of all personal charges that have been billed over 10 times, for example, or find all insurance charges for which you have resubmitted a claim more than twice. The report could also show you a list of all charges that have never been billed. Use this report to make sure charges are not slipping through your fingers. srs: Billing Report by Responsible Party-
The Billing Report by Responsible Party, located in the Billing and Collection section of the Smart Report Suite (
srs), will help your billing staff deal with outstanding insurance accounts. Use the report to quickly and easily find all insurance claims that were submitted more than 30 days ago, or any length of time you specify. With this report, you can keep an eye on unpaid charges that are approaching timely filing limits. srs: Billing and Collection Reports-
The Smart Report Suite (
srs) contains a number of reports that are useful for your daily billing needs. The Billing and Collection section, for example, has reports for generating a family billing history, a billing error report, and various aging tools to track outstanding charges. Remember that PCC also offers tools for customizing any existing SRS report or writing a new report from scratch. Contact PCC Software Support for more information.
End-of-Day Reports
The reports below help you prove out or wrap up your day. They also help you research any problems you find with your cash drawer.
daysheet-
The Daysheet report shows all charges, payments, and adjustments for any date range or a single day. If problems arise while balancing out at the end of a day, the
daysheetreport can help reveal why. Every entry includes the poster’s username. The report includes erased or “oops-ed” items, and there are many useful sorting and subtotal options.The
daysheetreport is located in the Proving Out window within the Billing Functions window of Practice Management. dailycheck-
The Daily Check program (
dailycheck) lists all the visits posted on a single day or range of days. The report includes every diagnosis, procedure, amount charged and payment posted. Usedailycheckto review a day’s postings and compare them against the encounter forms. Many office managers run dailycheck every evening or early the following morning.The
dailycheckreport is located in the Proving Out window within the Billing Functions window of Practice Management.For more information, read the Daily Check help article.
deposit-
The
depositreport lists all cash, check, and charge payments posted on a single day or date range. Checkdepositagainst your cash drawer at the end of the day or the end of a shift. Each item includes the username of the person who posted the payment. This report has many powerful sort and subtotal options.The
depositreport is located in the Proving Out window within the Billing Functions window of Practice Management. oopslog-
The Daily Corrections Log (
oopslog) can help you research daily activity in theoopsprogram. If you are having trouble understanding what happened with various charges or payments, theoopslogcan show you a complete record of all activity in theoopsprogram for any day.The
oopslogreport is located in the Proving Out window within the Billing Functions window of Practice Management. srs: Payment Detail By Check Number (in Posting Order)-
A payment’s check number is a convenient reference when untangling an end-of-day balance problem. The Payments Detail By Check Number, along with other payment reports in the Payments and Proving Out section of the Smart Report Suite (
srs), provides a list of check numbers along with relevant visit information. srs: Payment and Proving Out Reports-
This section of
srsincludes customizable versions ofdaysheetanddeposit. PCC can help you change these reports or usesrsgento create an end-of-day report tailored to the needs of your office.
Strategic and Long-Term Planning
These reports help you analyze whether or not your practice is making money. Use them to forecast future revenue, analyze your accounts receivable over a period of time, and help make strategic decisions at your practice.
In this category, you will find reports that help you analyze aggregate income from payors, learn about your practice’s population and growth, check your coding distribution for proper reimbursement, and perform other benchmark calculations.
Financial Analysis For Your Practice
How can you tell which insurance companies are paying you well and which ones need more proactive follow-up? Is your accounts receivable out of control? What was your total deposited income for the past three years? PCC’s financial analysis reports can answer all of these questions and more.
activity-
The Insurance Activity Summary (
activity) provides a quick review of all activity for each insurance group for any date range. Becauseactivitydisplays the number of visits and charges, you can quickly see which companies make up the largest part of your business. Since payments per visit are also on the report, you can useactivityto begin evaluating which companies are paying you well and which are paying you poorly. Theactivityreport is located in the Practice Management window. insaging-
The Insurance Accounts Receivable Summary (
insaging) shows an aged summary of your practice’s outstanding charges broken down by insurance group. Use it to see which carriers owe you the most money and how old those balances are.insagingis also a quick way to see your total A/R, and it can help you determine which insurance carriers need special attention. The report lists the percentages of your A/R for which each insurance group is responsible. Theinsagingreport is located in the Practice Management window. ira-
The Insurance Company Reimbursement Analysis (
ira) produces a number of different reports with a wide range of customizable options. You can useirato show procedure and charge activity for an entire year, compare the work done by different providers, evaluate the reimbursement levels of different insurance companies, and track payment of individual charges. With powerful subtotal and criteria options,irais a catch-all report that can answer many important questions when you are making financial decisions for your practice. Theirareport is located in the Practice Management window. ministats-
The
ministatsreport produces a break-down of your practice income for a given date range. How much money did you receive from credit card payments? How much did Aetna pay you last month? What was the total of all personal checks for 2005?ministatscan answer those questions and more. Theministatsreport is located in the Practice Management window. ardays-
The A/R Days (
ardays) report ages your accounts receivable and shows the number of days of work outstanding in each aging category.ardayscan tell you, for example, how many days of your accounts receivable are over 90 days old. Theardaysreport is located in the Practice Management window. aging-
The Insurance Accounts Receivable Summary (
insaging) shows an aged summary of your practice’s outstanding charges broken down by insurance group. Use it to see which carriers owe you the most money and how old those balances are.insagingis also a quick way to see your total A/R, and it can help you determine which insurance carriers need special attention. The report lists the percentages of your A/R for which each insurance group is responsible. Theagingreport is located in the Practice Management window. caprep-
The Capitated Plan Member Report (
caprep) provides usage numbers which can help you evaluate the pros and cons of a capitated plan. Thecaprepreport is located in the Practice Management window. utilize-
The Insurance Utilization (
utilize) report shows you all of the patients who visited during a given date range and had a certain insurance carrier as their primary payor. For example,utilizeshows you who your Aetna patients were last year, how many times they visited, and how much was charged to them. -
The ARRA report reports on the Medicaid status of visits by patients within a given time frame. It is designed to help your office determine if you may qualify for the ARRA incentive program. For more information, read the ARRA Report help article.
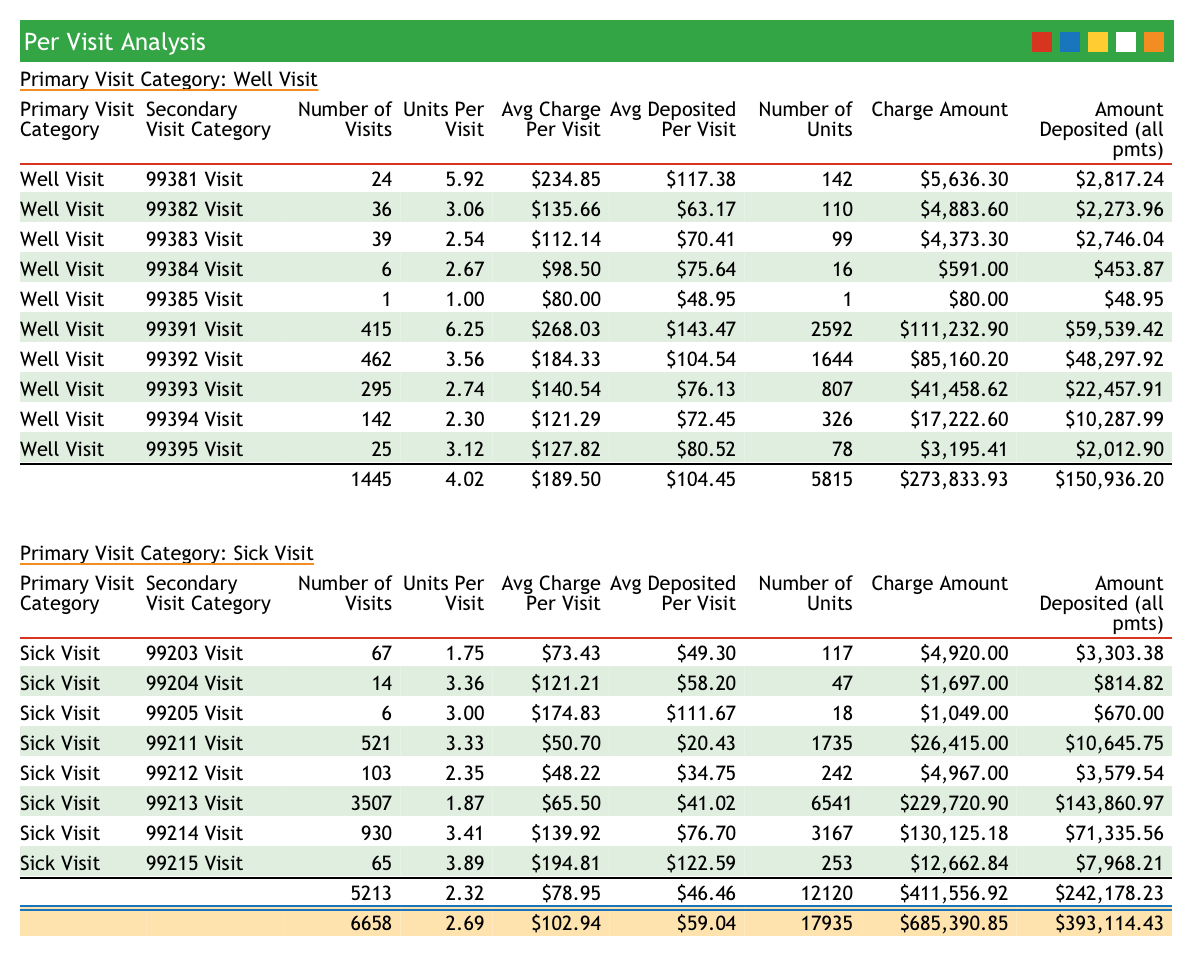
srs: Per Visit Analysis-
The Per Visit Analysis report details how much work your office is doing for each visit category and coding level.
srs: Per Visit Analysis By Payor-
The Per Visit Analysis By Payor (
activitystyle) report will show you your total and per-visit revenue, broken down by payor. Here is an example: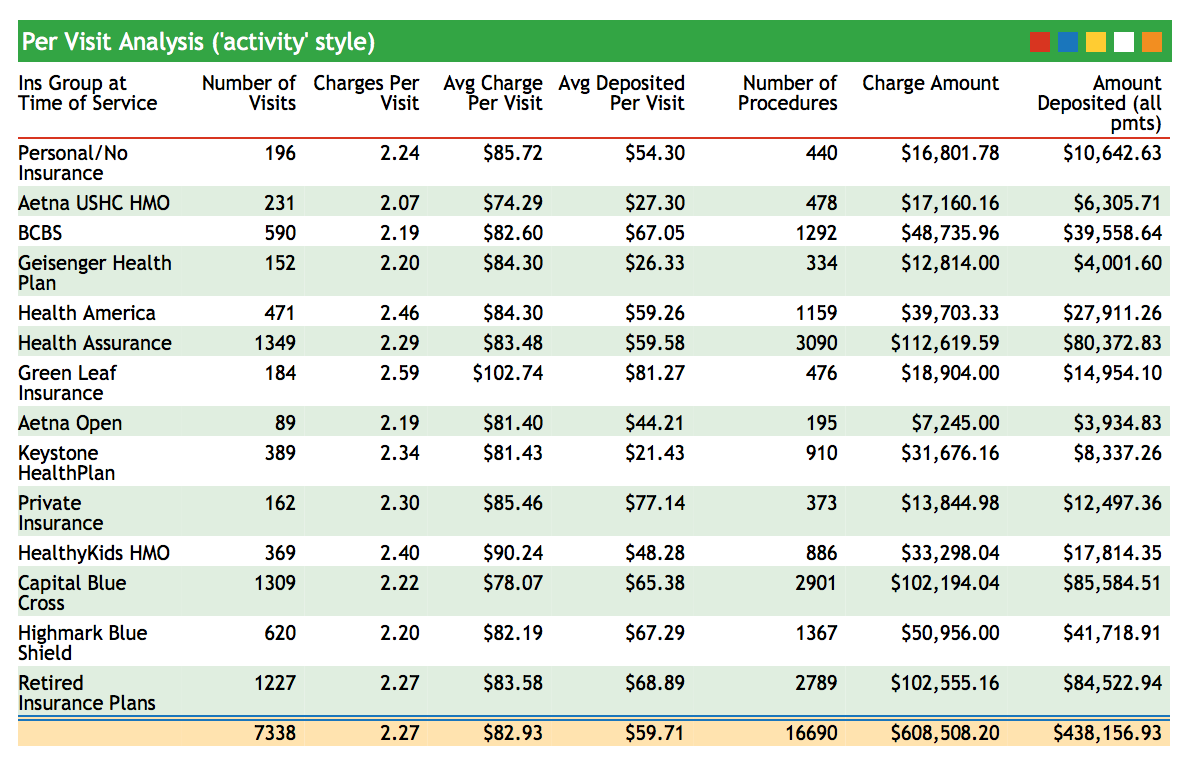
Use this report to compare payors and review your activity for a given date range.
srs: Other Financial and Practice Management Reports-
The Smart Report Suite has dozens of excellent reports for the practice manager, including a Billing and Collection Reports Section, a Trend Analysis section, and sections with reports analyzing charges and visits. Remember that every
srsreport can be customized to the specific needs of your practice. Contact PCC Software Support for help at 1-800-722-7708.
arra
Benchmarks
While reviewing your accounts receivable and your procedures performed is important, you can also use reports to compare your practice’s activity to national standards or to your own practice over a period of time. Knowing your numbers is great, but knowing whether or not they are good numbers is even better. PCC has created a subsection of the Smart Report Suite (srs) dedicated to benchmark reports.
srs: Aging by Responsible Party and Provider-
This report shows what percentage of your business is tied up in each of your insurance groups and includes aging categories.
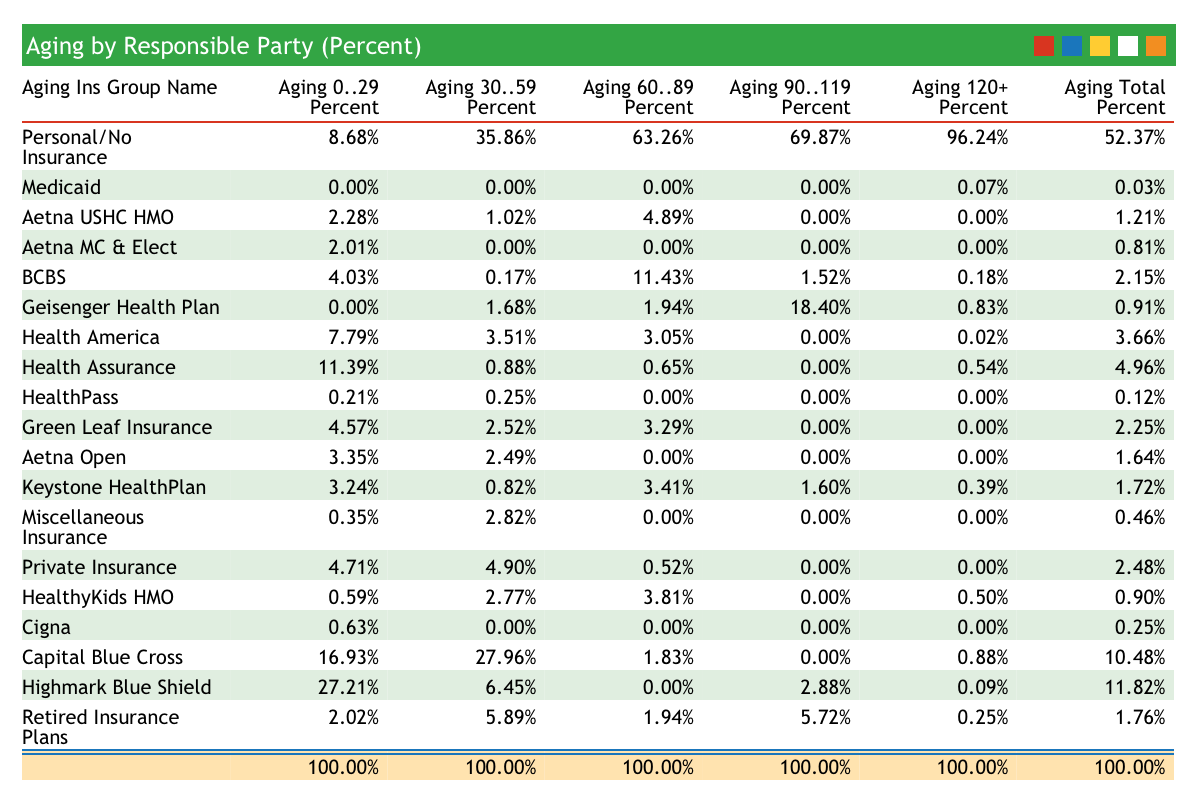
The Aging categories at the top of the report indicate the days since the time of service. Use this report to evaluate your weaknesses in accounts receivable and see how long different carriers take to pay. The practice in the image above has an excellent insurance accounts receivable, with few claims outstanding beyond 60 days. Their private-pay collections may need improvement, however.
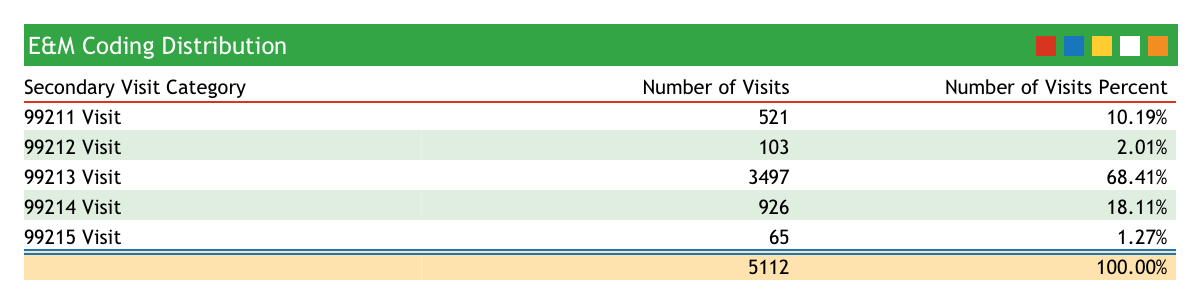
srs: E&M Coding Distribution (Practice Total)-
Does your practice charge a typical sick visit coding distribution? This report totals all of the sick visits performed for a specified date range and displays the totals for each visit category. Use this report to review your sick visit coding over a period of time. For the practice in the report below, 99213 visits account for about 68% of all sick visits.
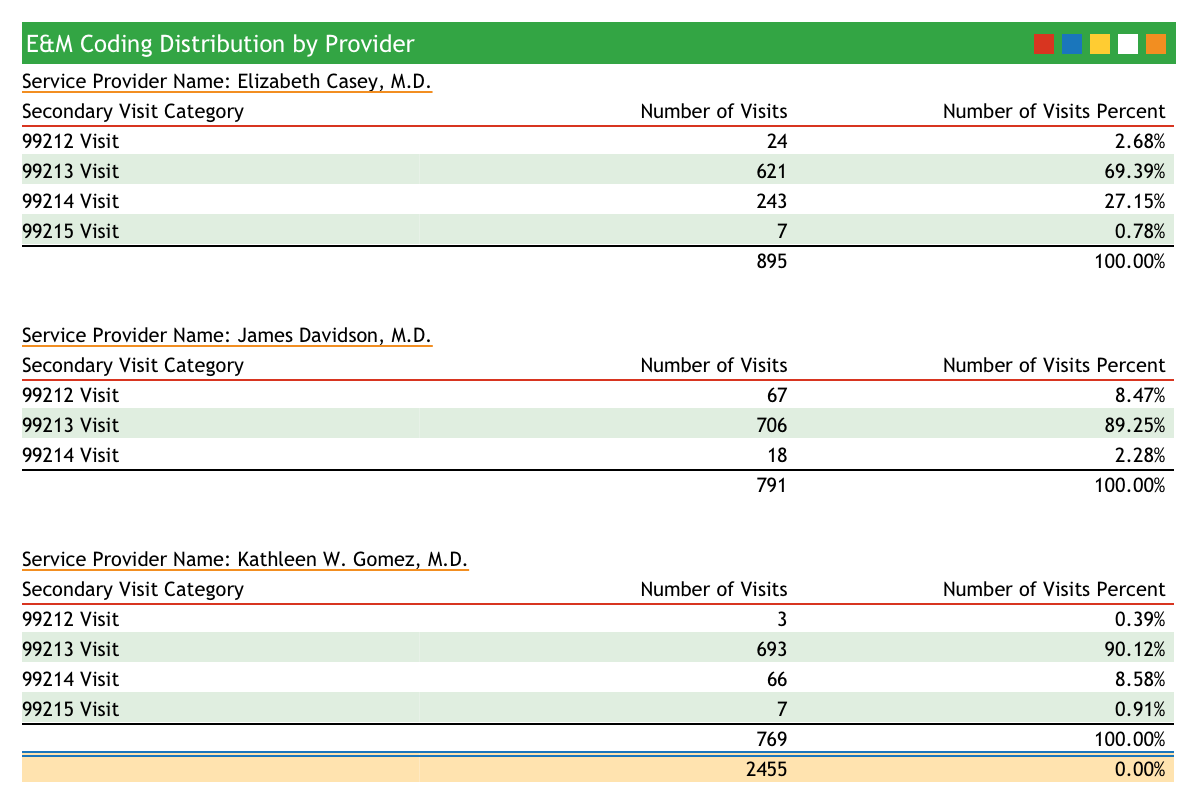
srs: E&M Coding Distribution by Provider-
This report compares sick visit coding frequency and subtotals by provider. Run this report to examine the sick-visit coding behavior of each of your providers.
srs: Gross Collection Ratio Report-
The Gross Collection Ratio shows total charges and collections for each insurance groups, grouped by year. The report shows percentages so that you can see what percentage of each insurance group’s charges end up as deposits.
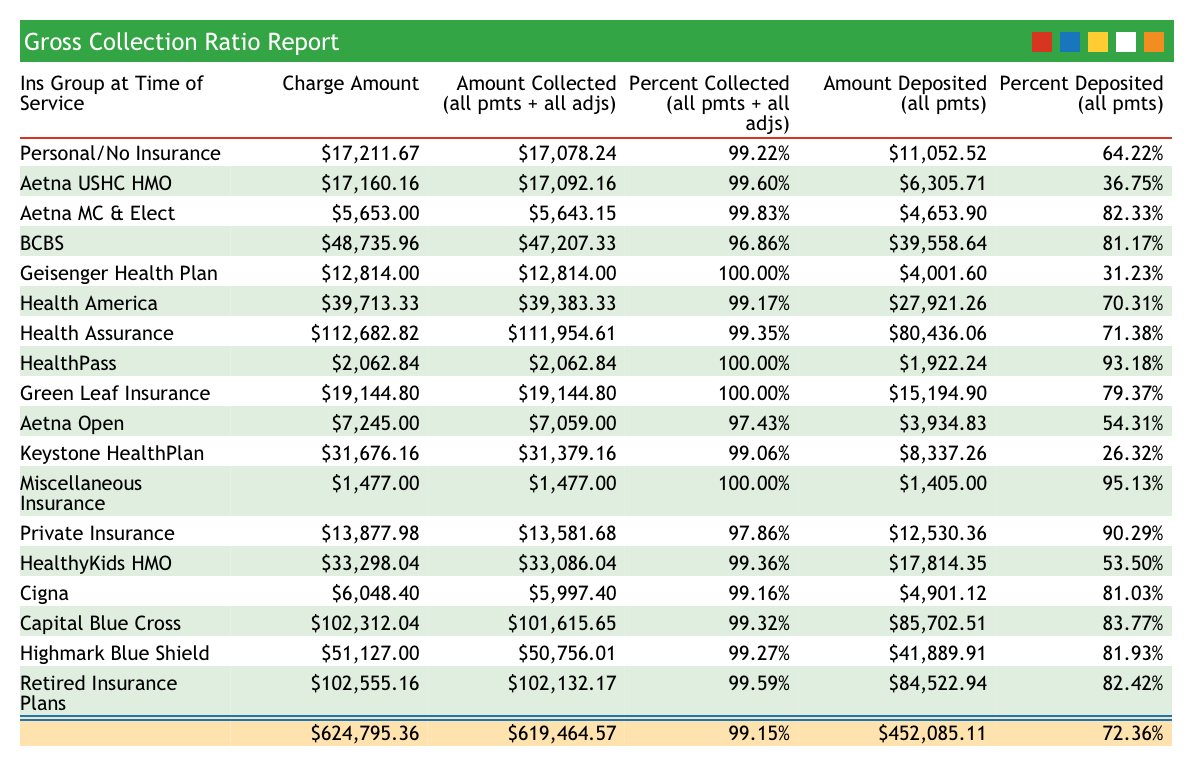
Use this report as a quick comparison of how well different insurance companies reimburse.
srs: Total Active Patients (by Sex and Age Group)-
The Total Active Patients (by Sex and Age Group) report in
srsshows a summary of age and sex distribution at your practice.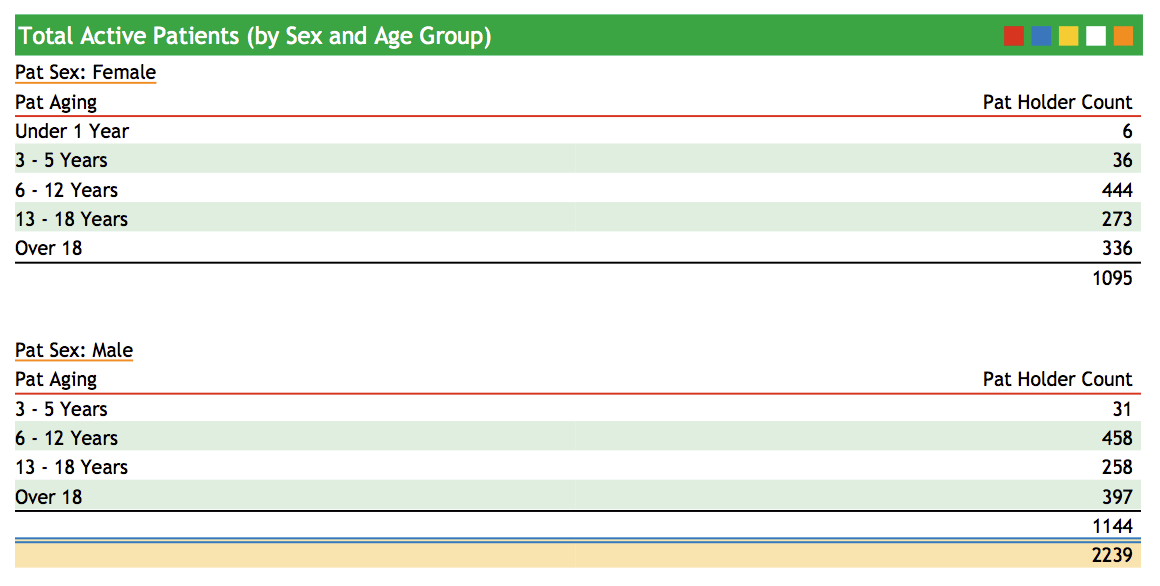
If you are a pediatric practice, you can monitor your age distribution to make sure your patient base is weighted towards younger patients. This report is also a convenient way to track practice population. To see this report, run
srs, select Patient Demographic and Policy Reports, and then select Total Active Patients (by Sex and Age Group). srs: Payor Mix Analysis-
How much of your practice’s income depends on a single payor? Do some insurance groups constitute a large percentage of your work done but a smaller percentage of your actual income?
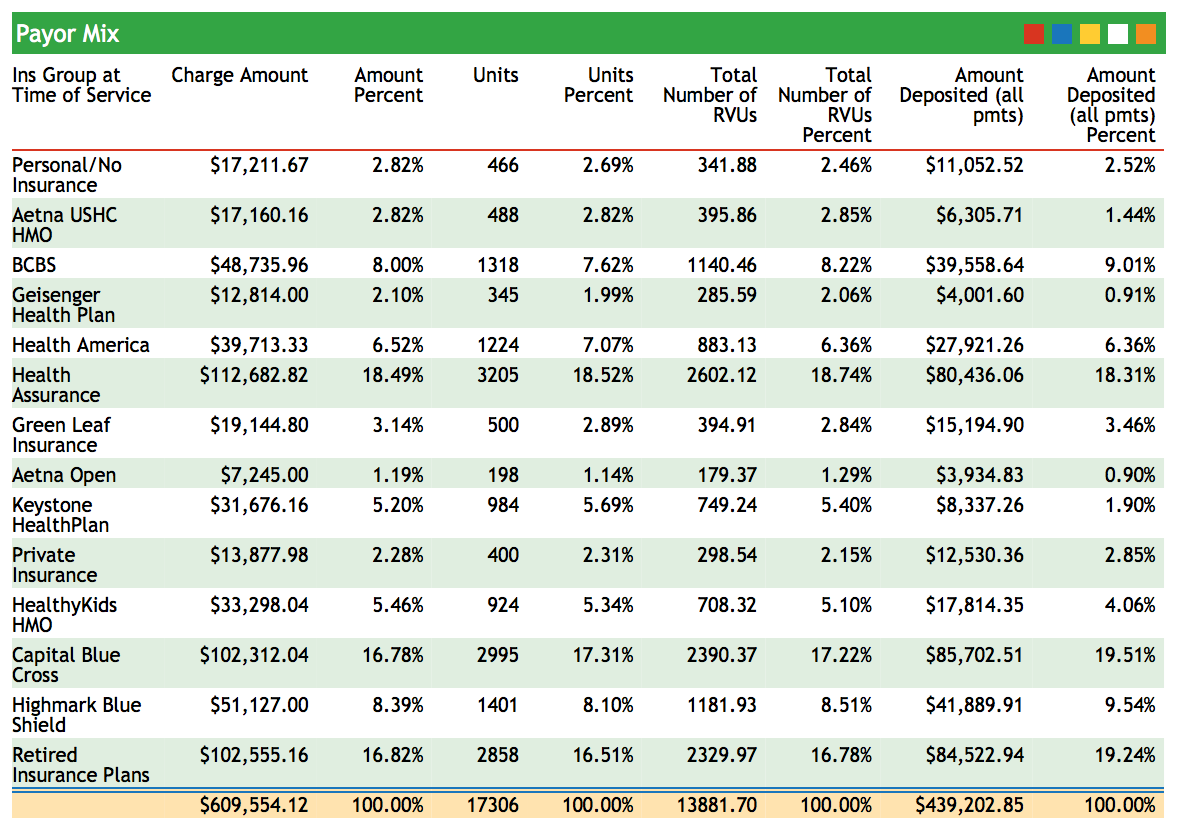
The Payor Mix Analysis report shows charge and payment percentages, along with units, RVUs, and Deposits. This report can help you understand how important each payor is to your practice.
srs: Per Visit Analysis by Payor-
This report analyzes your charge data by visit category. For example, it can compare different levels of Well and Sick visits. The visit types are sorted by insurance group. The report includes total procedures performed for each visit type.
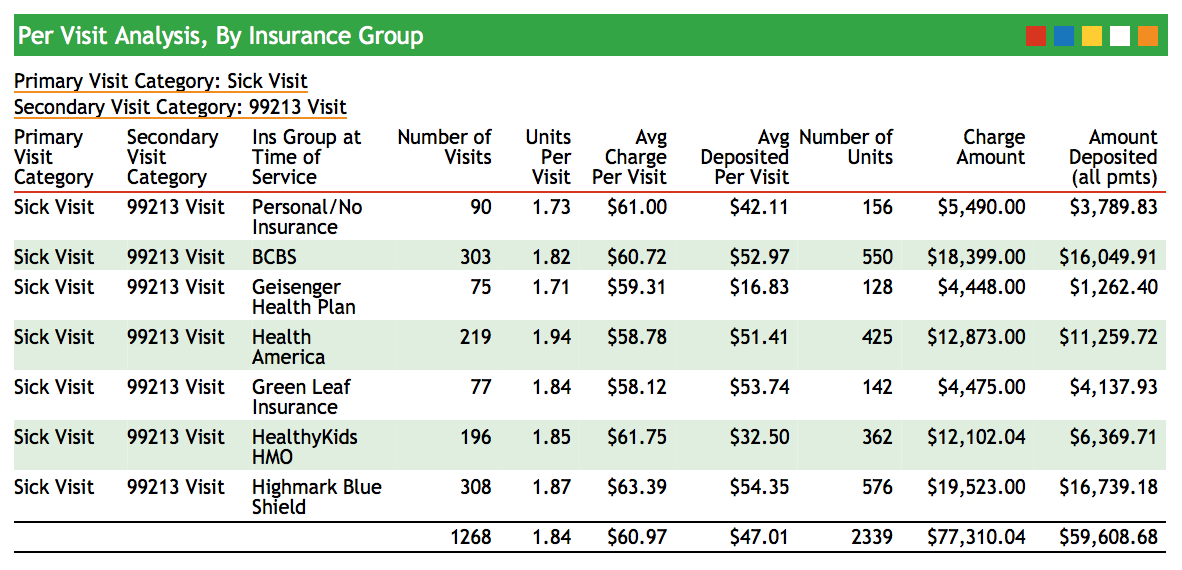
Use this report to evaluate in more detail if the work done for each insurance group correlates to the amount deposited.
srs: Per Visit Analysis By Provider-
The Per Visit Analysis By Provider shows how many of each visit type your providers performed. Use this data to plot the coding curve of each of your providers as well as to review the workload of each provider for any date range.
srs: Pricing Analysis (RVU Report per Procedure)-
The Pricing Analysis (RVU Report per Procedure) report shows your Practice’s average price for each procedure you performed during a specified date range and compares it to the standard Medicaid reimbursement for your region. Because the report shows total procedures performed for a given date range and can calculate expected reimbursement based on a percentage of Medicare’s reimbursement, you will be able to spot procedures for which you may be undercharging.
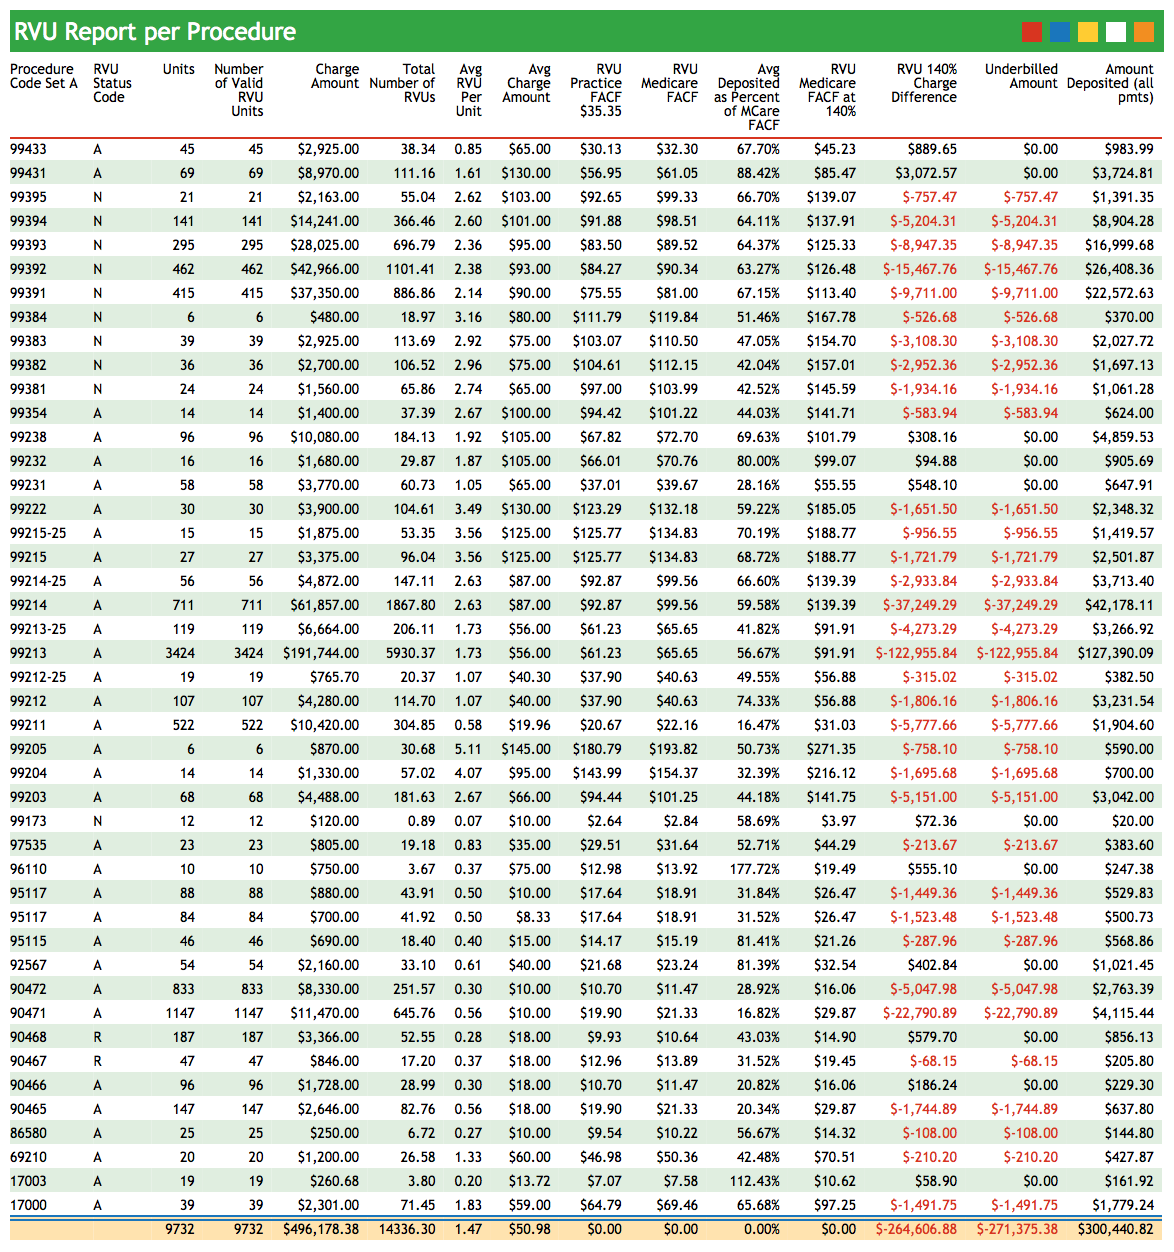
You can use this report to calculate new prices based on a percentage of Medicare’s reimbursement and review the possible effects of the price change.
srs: Total RVUs By Provider-
The Total RVUs By Provider Report summarizes the work done by each provider in your practice. Rather than measuring work by the number of visits, this report compares the number of RVU units performed and amount charged by each provider.
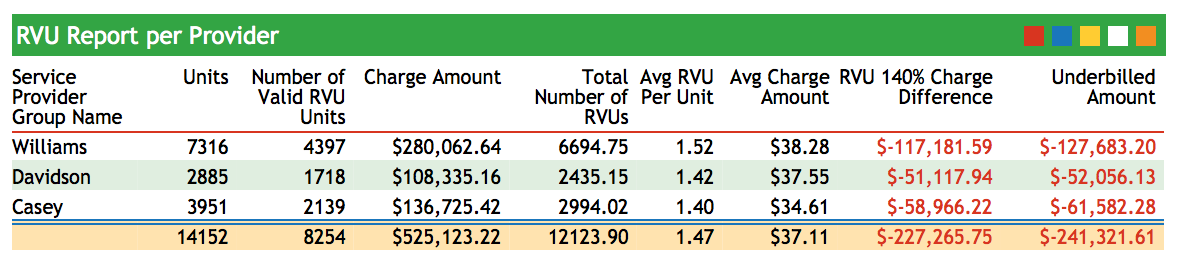
Use this report to analyze provider performance and reveal patterns of under or over-coding.
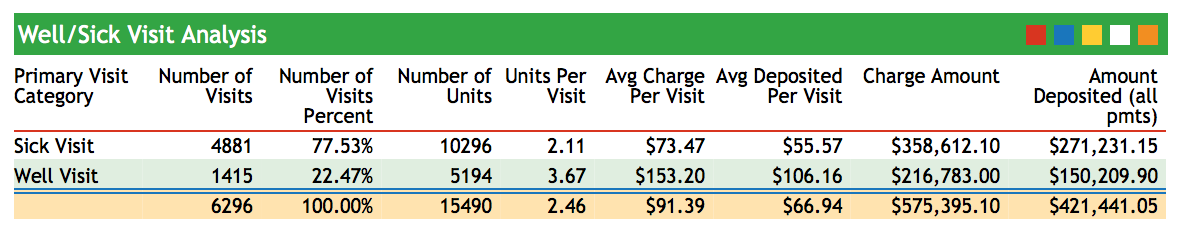
srs: Sick/Well Visit Analysis (Practice Average)-
The Sick/Well Visit Analysis displays the number of sick and well visits performed at your practice for a specified date range. Total amounts charged and deposited are also displayed, illustrating how each visit type contributes to your practice’s total revenue.
srs: Sick/Well Visit Analysis by Provider-
This report compares visit-type data among your providers.
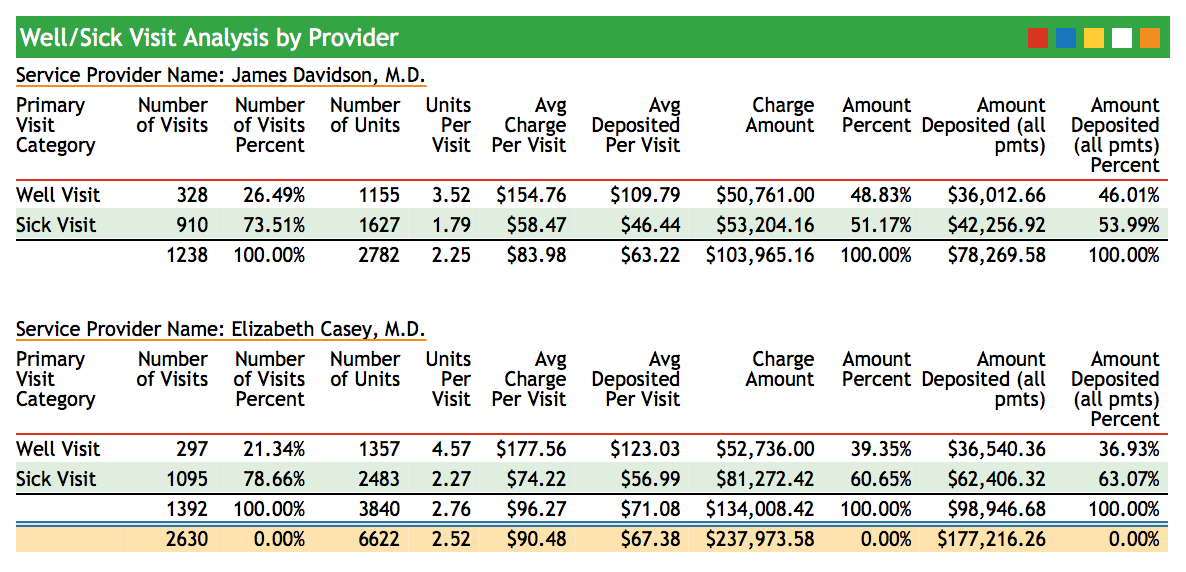
Use this report to see the total number of sick and well visits each provider saw within a specified date range.