SRS Financial Report Reference
The Smart Report Suite (srs), found in PCC’s former software suite (Partner), contains a number of useful reports for financial analysis. Read below to learn about some of the default reports. You can also create your own reports in SRS, and export SRS reports for use in a spreadsheet.
srs: Billing Report by Family-
The Billing Report by Family, located in the Billing and Collection section of the Smart Report Suite (
srs), will help you find personal or insurance bills that have been billed multiple times. You can use the report to create a list of all personal charges that have been billed over 10 times, for example, or find all insurance charges for which you have resubmitted a claim more than twice. The report could also show you a list of all charges that have never been billed. Use this report to make sure charges are not slipping through your fingers. srs: Billing Report by Responsible Party-
The Billing Report by Responsible Party, located in the Billing and Collection section of the Smart Report Suite (
srs), will help your billing staff deal with outstanding insurance accounts. Use the report to quickly and easily find all insurance claims that were submitted more than 30 days ago, or any length of time you specify. With this report, you can keep an eye on unpaid charges that are approaching timely filing limits. srs: Billing and Collection Reports-
The Smart Report Suite (
srs) contains a number of reports that are useful for your daily billing needs. The Billing and Collection section, for example, has reports for generating a family billing history, a billing error report, and various aging tools to track outstanding charges. Remember that PCC also offers tools for customizing any existing SRS report or writing a new report from scratch. Contact PCC Software Support for more information.
srs: Payment Detail By Check Number (in Posting Order)A payment’s check number is a convenient reference when untangling an end-of-day balance problem. The Payments Detail By Check Number, along with other payment reports in the Payments and Proving Out section of the Smart Report Suite (srs), provides a list of check numbers along with relevant visit information.
srs: Payment and Proving Out ReportsThis section of srs includes customizable versions of daysheet and deposit. PCC can help you change these reports or use srsgen to create an end-of-day report tailored to the needs of your office.
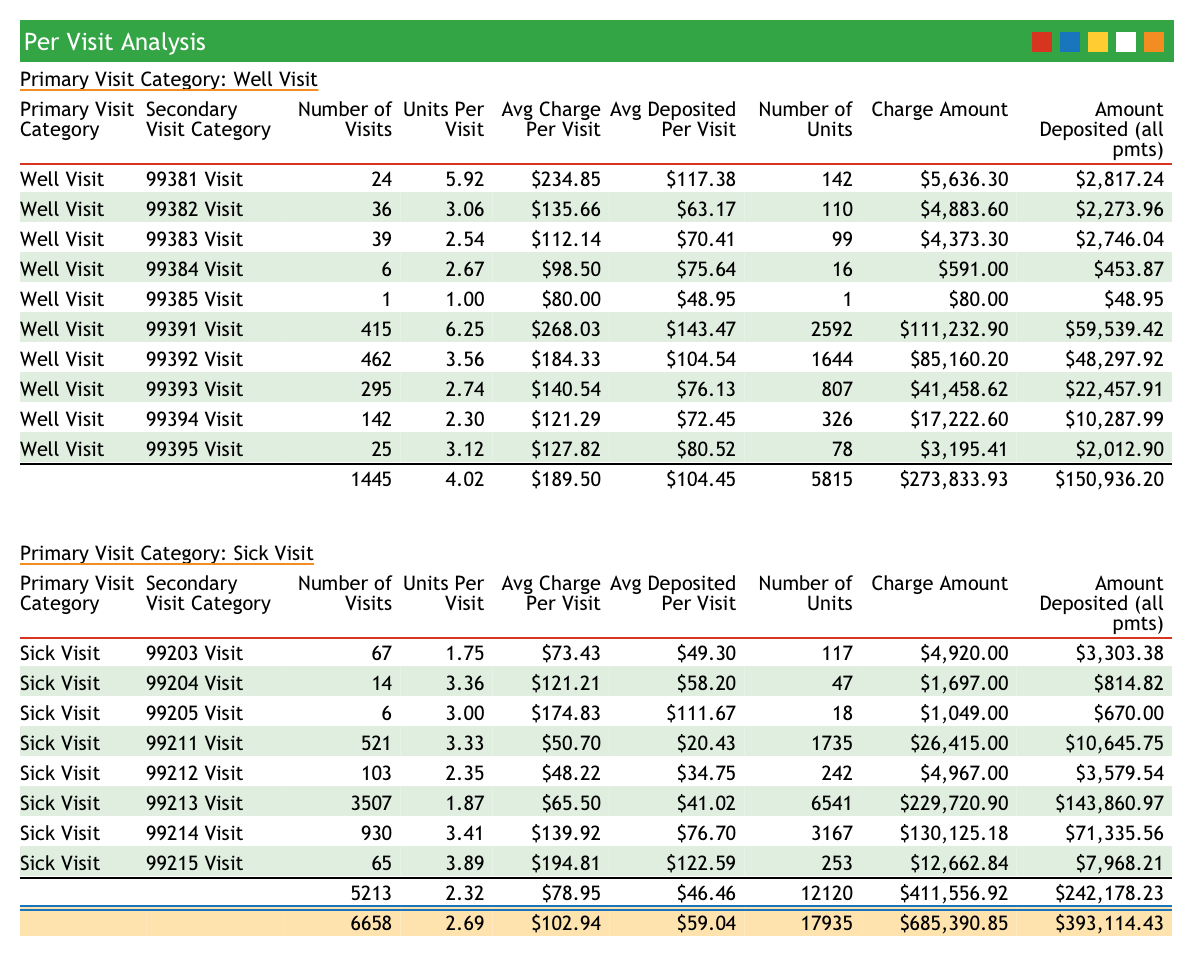
srs: Per Visit AnalysisThe Per Visit Analysis report details how much work your office is doing for each visit category and coding level.
srs: Per Visit Analysis By PayorThe Per Visit Analysis By Payor (activity style) report will show you your total and per-visit revenue, broken down by payor. Here is an example:
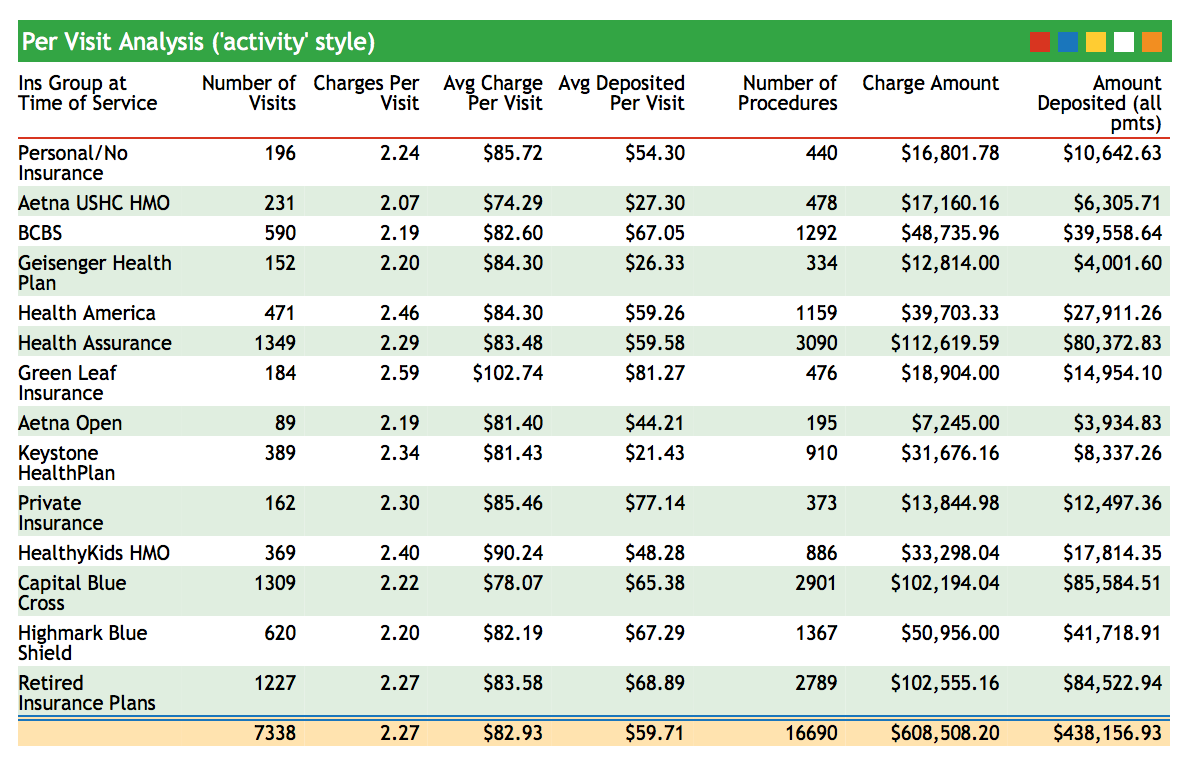
Use this report to compare payors and review your activity for a given date range.
srs: Other Financial and Practice Management ReportsThe Smart Report Suite has dozens of excellent reports for the practice manager, including a Billing and Collection Reports Section, a Trend Analysis section, and sections with reports analyzing charges and visits. Remember that every srs report can be customized to the specific needs of your practice. Contact PCC Software Support for help at 802-846-8177 or 800-722-7708.
srs: Aging by Responsible Party and ProviderThis report shows what percentage of your business is tied up in each of your insurance groups and includes aging categories.
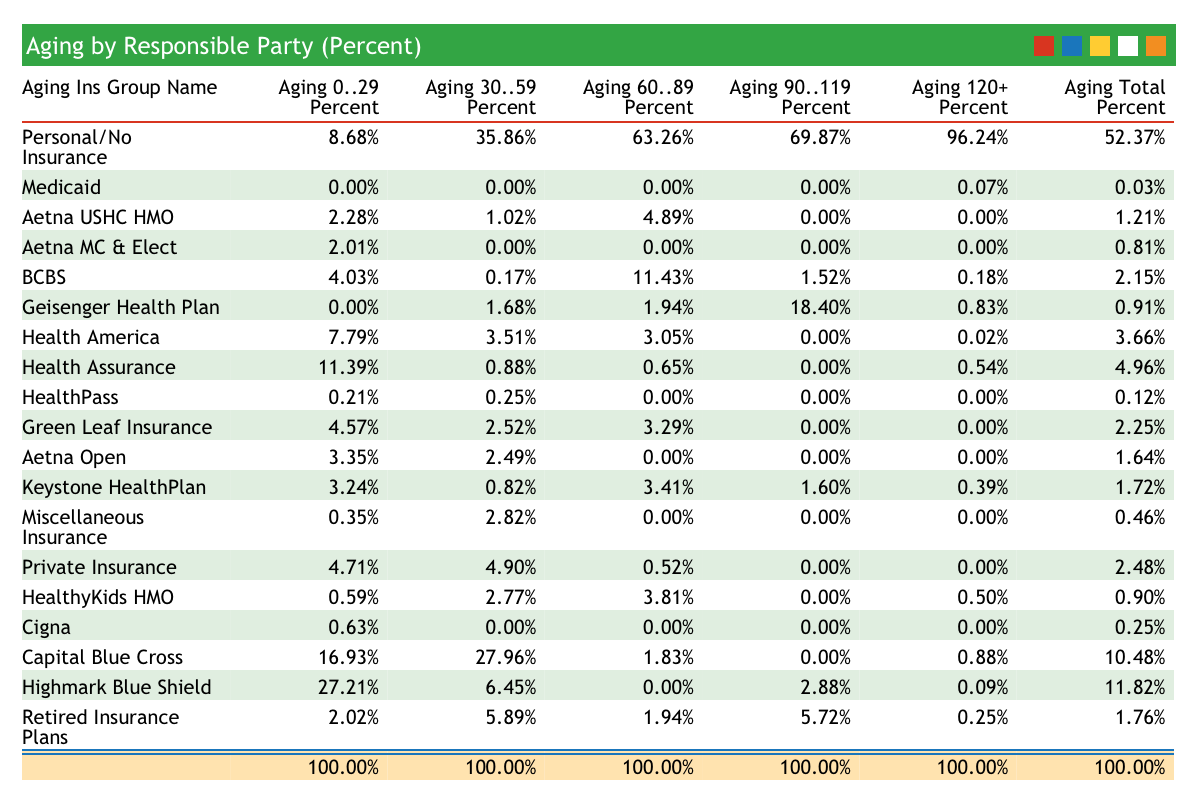
The Aging categories at the top of the report indicate the days since the time of service. Use this report to evaluate your weaknesses in accounts receivable and see how long different carriers take to pay. The practice in the image above has an excellent insurance accounts receivable, with few claims outstanding beyond 60 days. Their private-pay collections may need improvement, however.
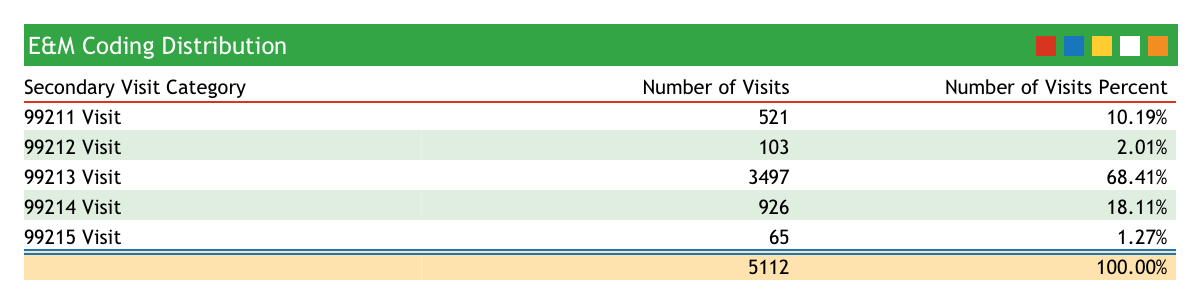
srs: E&M Coding Distribution (Practice Total)Does your practice charge a typical sick visit coding distribution? This report totals all of the sick visits performed for a specified date range and displays the totals for each visit category. Use this report to review your sick visit coding over a period of time. For the practice in the report below, 99213 visits account for about 68% of all sick visits.
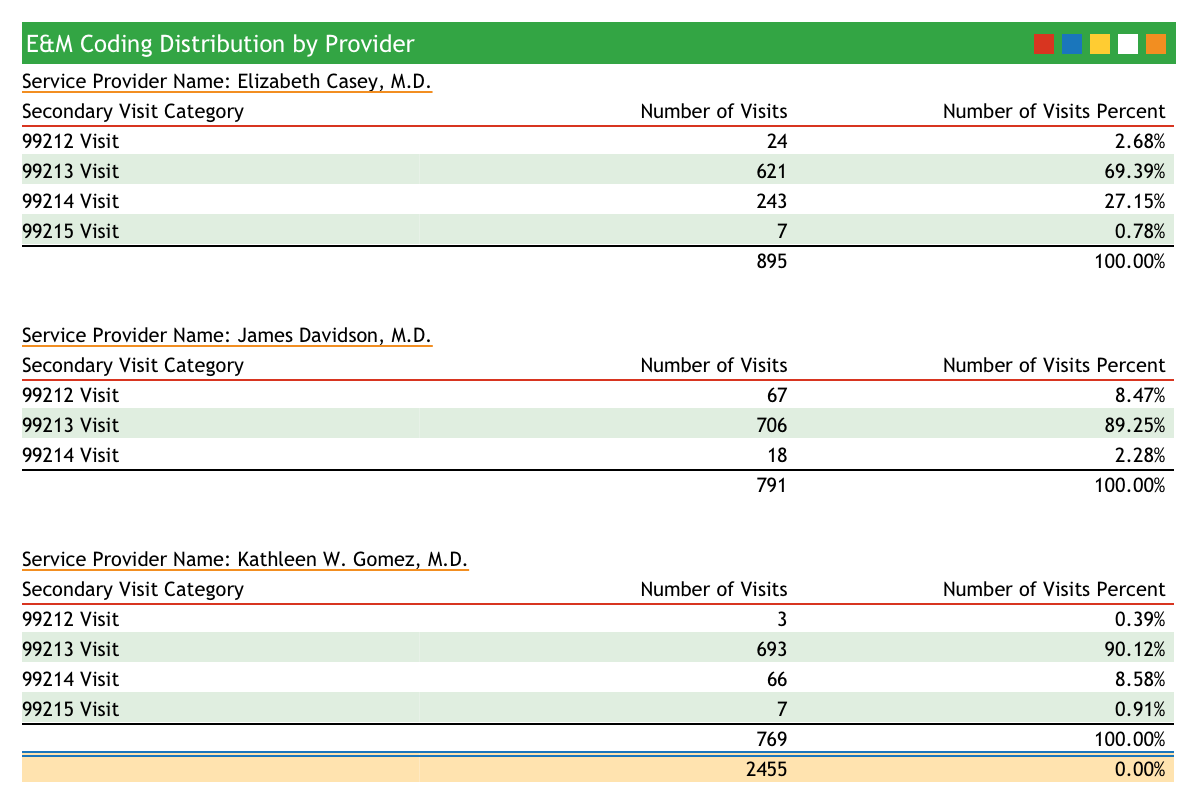
srs: E&M Coding Distribution by ProviderThis report compares sick visit coding frequency and subtotals by provider. Run this report to examine the sick-visit coding behavior of each of your providers.
srs: Gross Collection Ratio ReportThe Gross Collection Ratio shows total charges and collections for each insurance groups, grouped by year. The report shows percentages so that you can see what percentage of each insurance group’s charges end up as deposits.
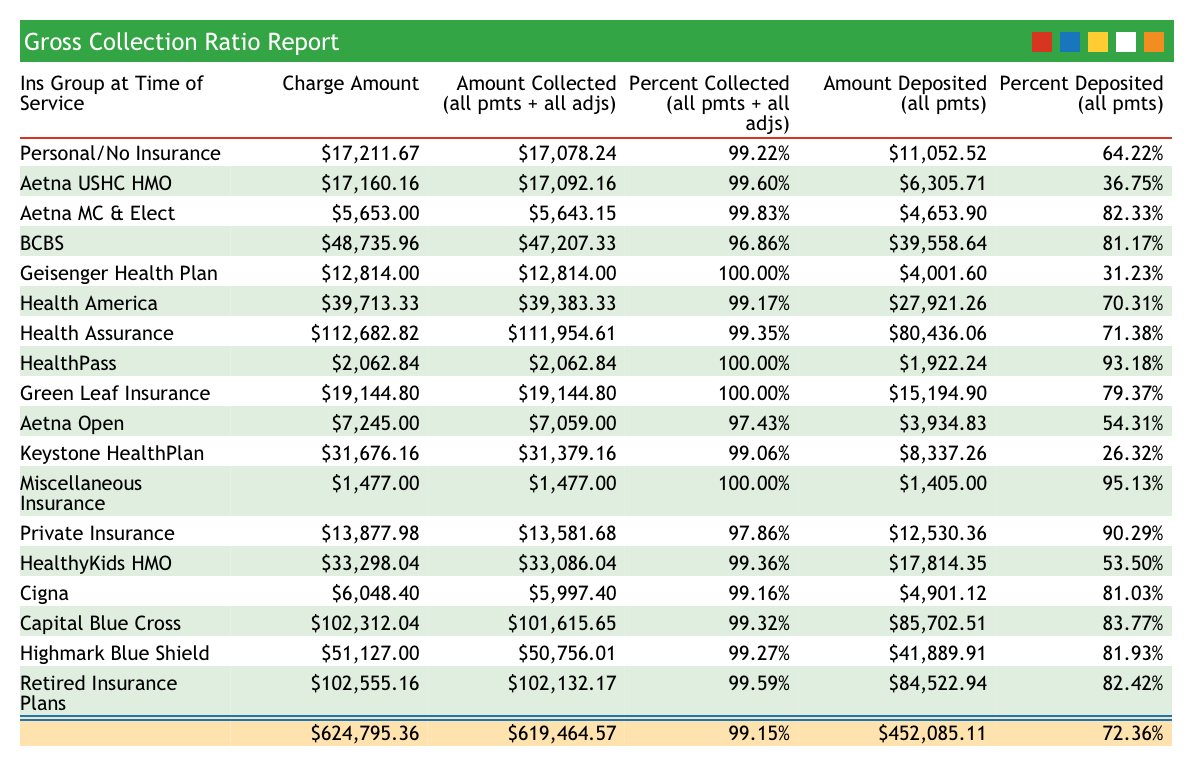
Use this report as a quick comparison of how well different insurance companies reimburse.
srs: Total Active Patients (by Sex and Age Group)The Total Active Patients (by Sex and Age Group) report in srs shows a summary of age and sex distribution at your practice.
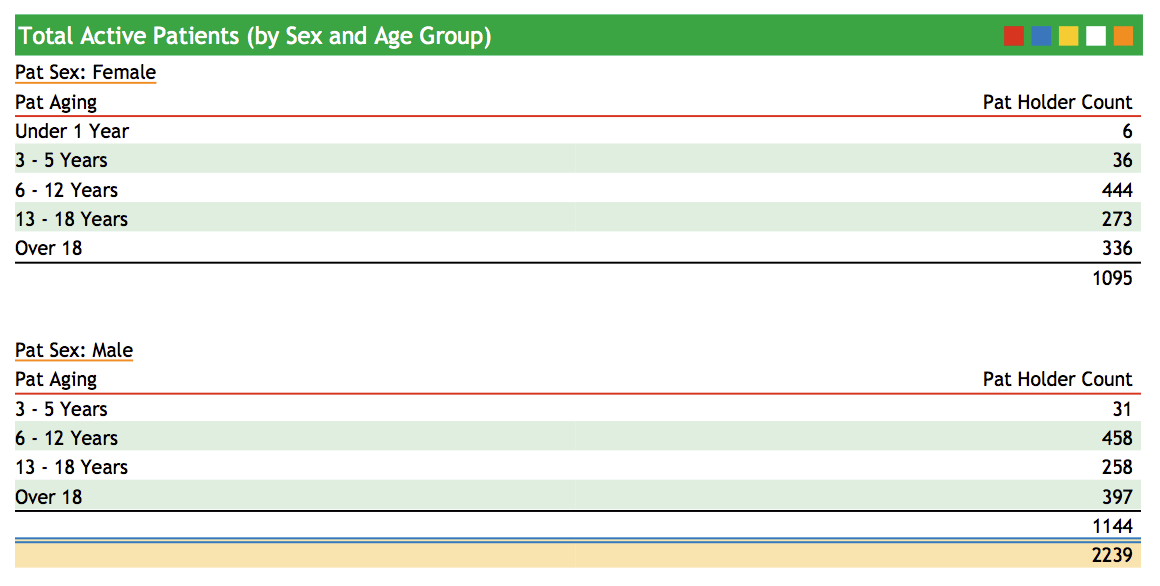
If you are a pediatric practice, you can monitor your age distribution to make sure your patient base is weighted towards younger patients. This report is also a convenient way to track practice population. To see this report, run srs, select Patient Demographic and Policy Reports, and then select Total Active Patients (by Sex and Age Group).
srs: Payor Mix AnalysisHow much of your practice’s income depends on a single payor? Do some insurance groups constitute a large percentage of your work done but a smaller percentage of your actual income?
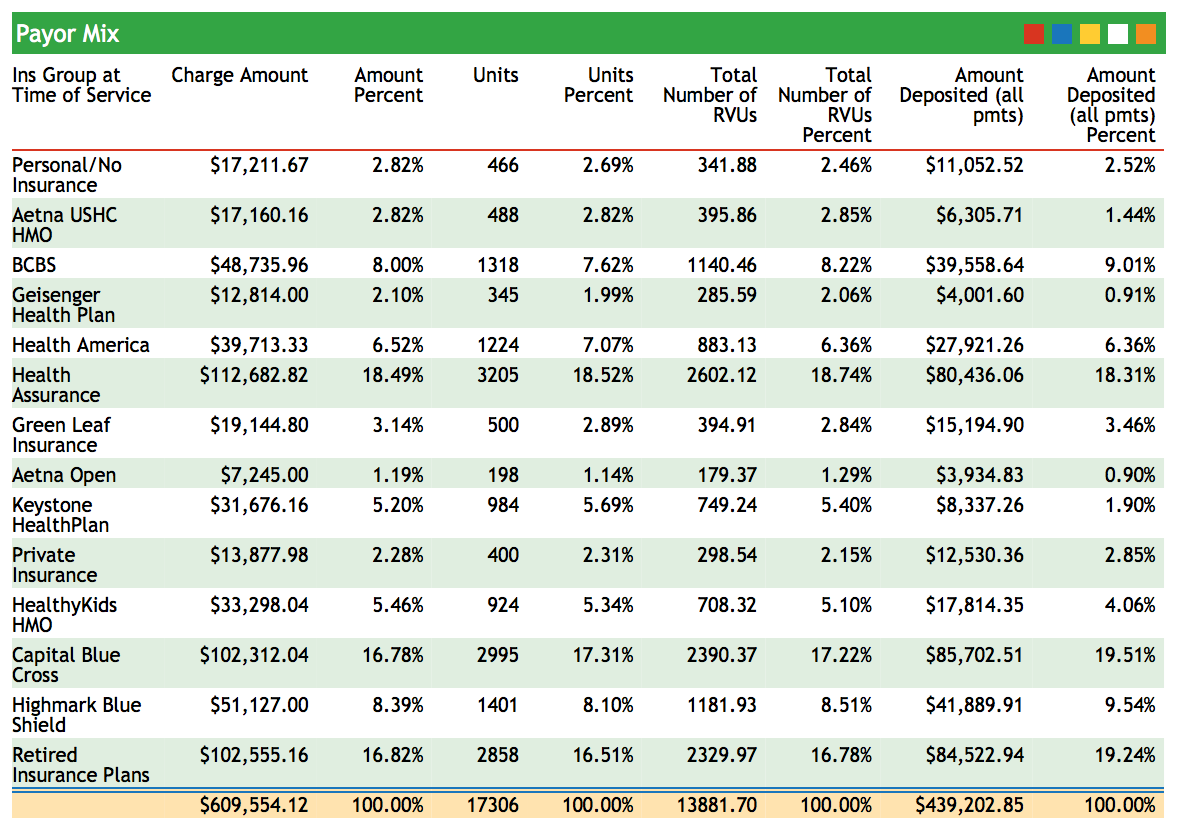
The Payor Mix Analysis report shows charge and payment percentages, along with units, RVUs, and Deposits. This report can help you understand how important each payor is to your practice.
srs: Per Visit Analysis by PayorThis report analyzes your charge data by visit category. For example, it can compare different levels of Well and Sick visits. The visit types are sorted by insurance group. The report includes total procedures performed for each visit type.
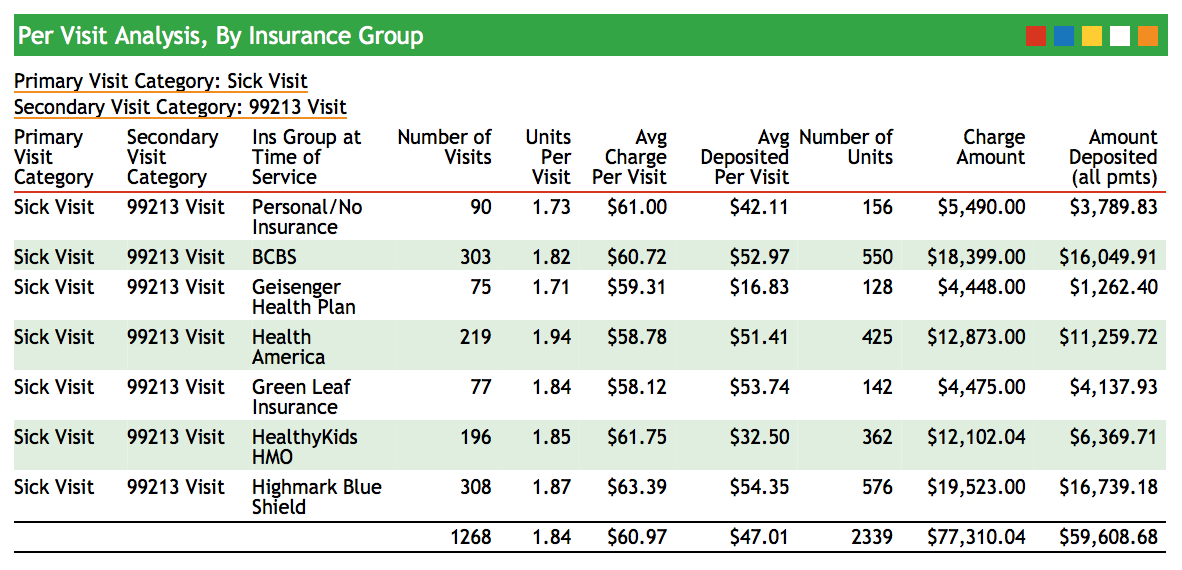
Use this report to evaluate in more detail if the work done for each insurance group correlates to the amount deposited.
srs: Per Visit Analysis By ProviderThe Per Visit Analysis By Provider shows how many of each visit type your providers performed. Use this data to plot the coding curve of each of your providers as well as to review the workload of each provider for any date range.
srs: Pricing Analysis (RVU Report per Procedure)The Pricing Analysis (RVU Report per Procedure) report shows your Practice’s average price for each procedure you performed during a specified date range and compares it to the standard Medicaid reimbursement for your region. Because the report shows total procedures performed for a given date range and can calculate expected reimbursement based on a percentage of Medicare’s reimbursement, you will be able to spot procedures for which you may be undercharging.
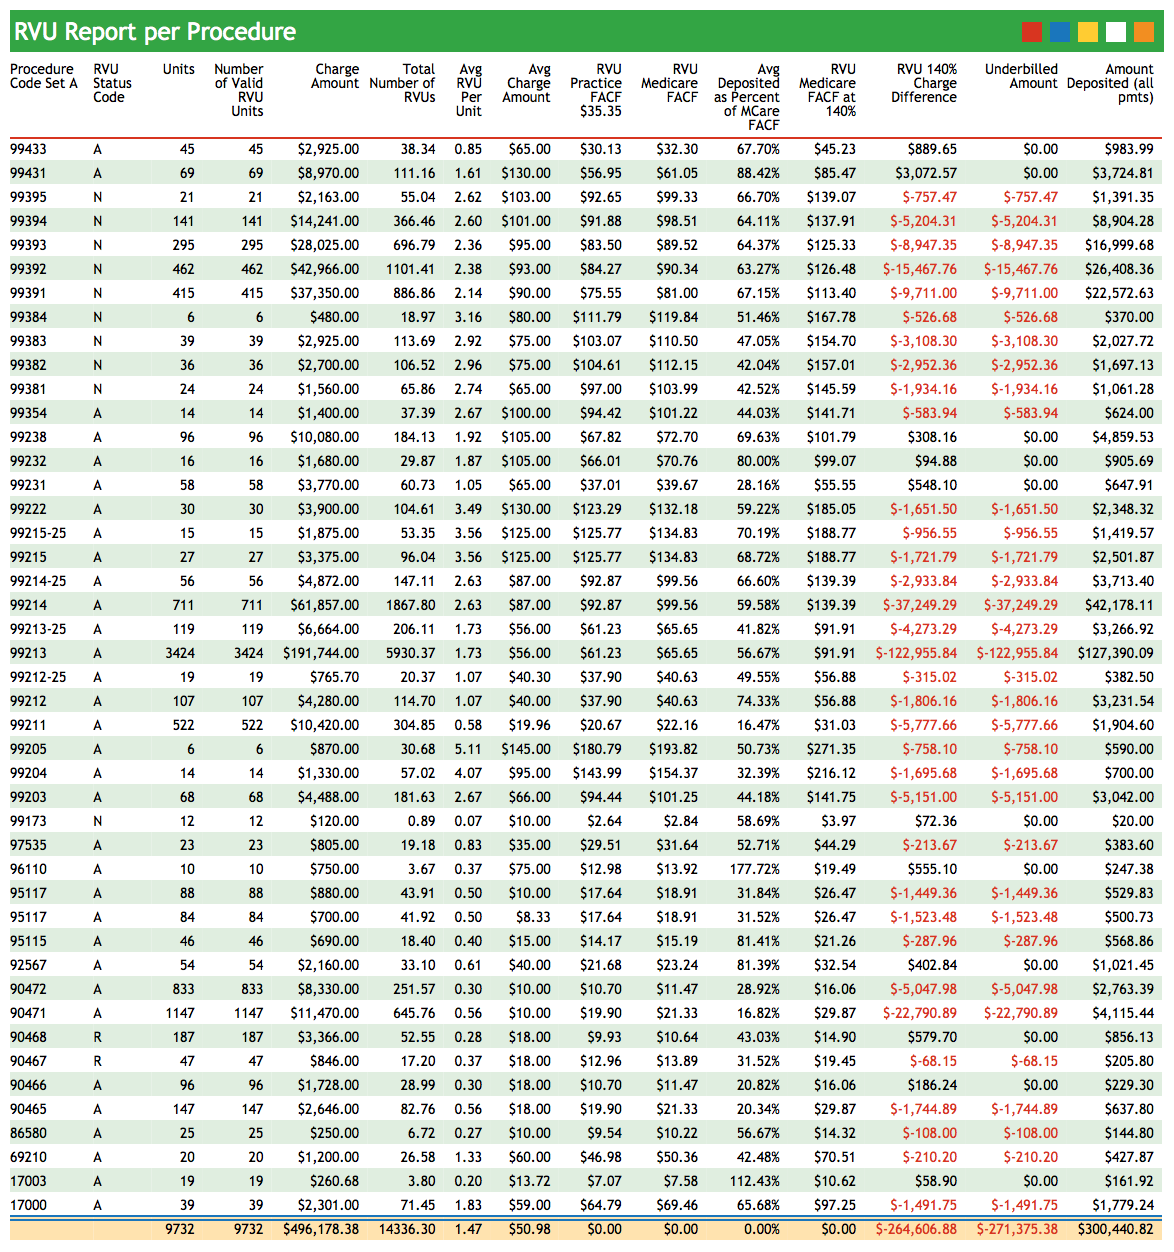
You can use this report to calculate new prices based on a percentage of Medicare’s reimbursement and review the possible effects of the price change.
srs: Total RVUs By ProviderThe Total RVUs By Provider Report summarizes the work done by each provider in your practice. Rather than measuring work by the number of visits, this report compares the number of RVU units performed and amount charged by each provider.
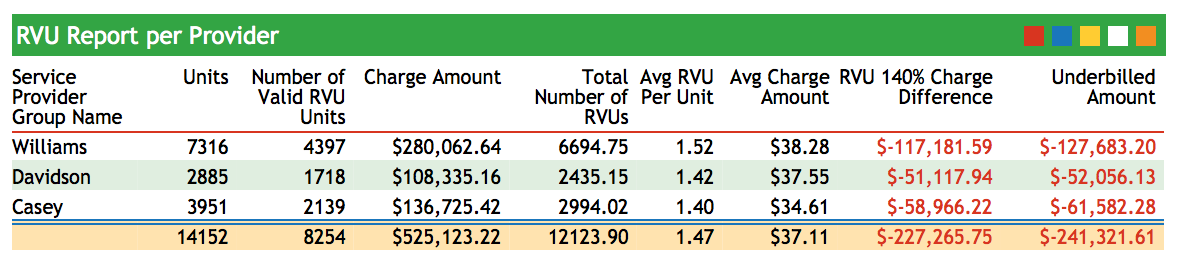
Use this report to analyze provider performance and reveal patterns of under or over-coding.
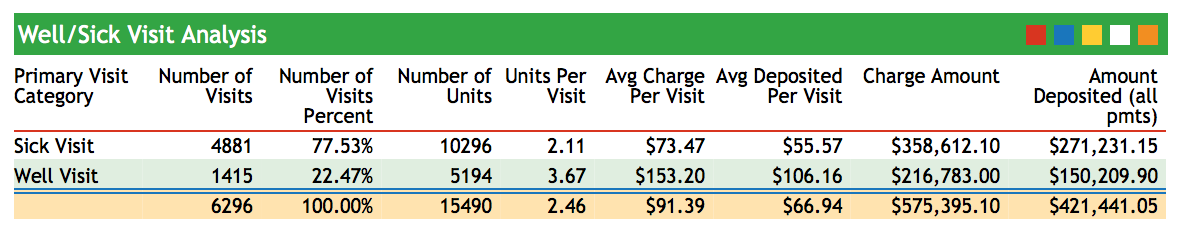
srs: Sick/Well Visit Analysis (Practice Average)The Sick/Well Visit Analysis displays the number of sick and well visits performed at your practice for a specified date range. Total amounts charged and deposited are also displayed, illustrating how each visit type contributes to your practice’s total revenue.
srs: Sick/Well Visit Analysis by ProviderThis report compares visit-type data among your providers.
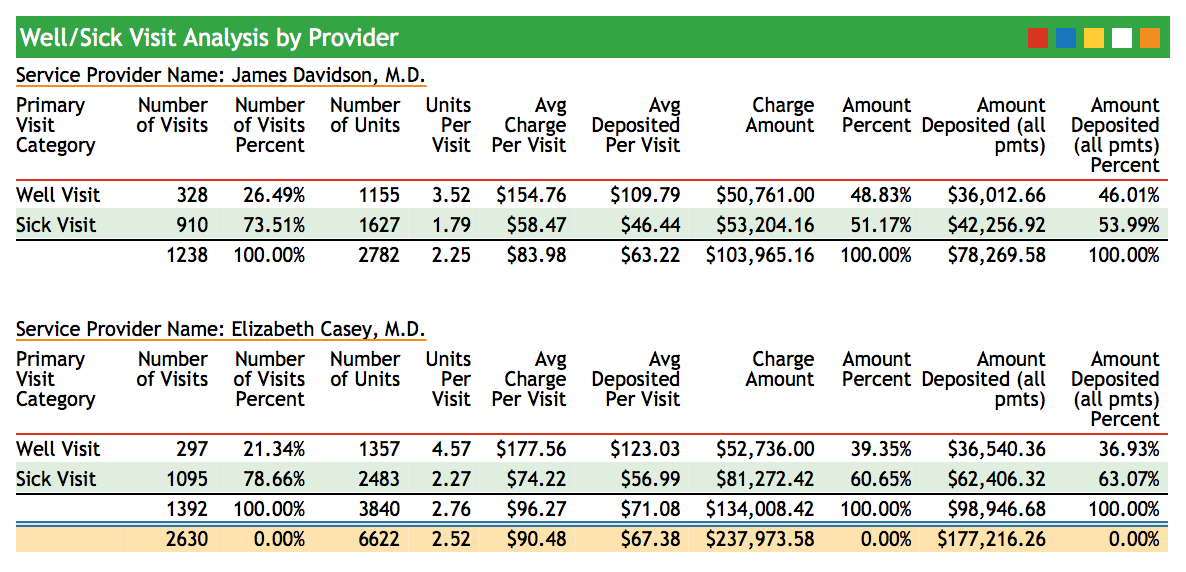
Use this report to see the total number of sick and well visits each provider saw within a specified date range.