Report on Schedule Usage
How do you know what proportion of your provider’s schedule is being filled? How do you assess the distribution of scheduled visit types, blocks, or minutes available for each provider, year over year? How can you tell if you’re making the most of your scheduling resources?
The Provider Schedule Utilization Report is a flexible reporting tool that allows your practice to understand the appointment distribution of your provider’s schedules and locations over time.
This article outlines a few of the recommended uses and considerations for the Provider Schedule Utilization Report. For general information about reporting in PCC EHR, read Run Reports in the Report Library.
Contents
Get the Most Out of the Provider Schedule Utilization Report
Before you report on how your providers’ schedules are being used, get familiar with your practice’s scheduling setup. To get the most of out the Provider Schedule Utilization report, consider the following guidelines:
- Accurate Templates: This report measures based on your providers’ schedule templates. Configure your provider hours and scheduling templates so that available times display on the Appointment Book as accurately as possible. To learn about how to create a template, read the Configure the Appointment Book article.
- Specific Visit Reasons: Customize your sick, well, and other visit reasons for more accurate reporting on these criteria. For a tutorial on configuring visit reasons, check out the Configure Visit Reasons section of this configuration guide.
- Prudent Use of Blocks: If you are using blocks to indicate regular time off, consider painting that off time into your providers’ schedules instead. You can find out more about how to create a block in the Schedule a Patient article.
- Forced Appointments Considerations: If your practice regularly forces appointments, consider whether the schedule template could be adjusted to reflect your schedule format more accurately. Forced appointments are counted toward total minutes on this report.
- Wave Scheduling Considerations: If your practice uses wave scheduling, provider schedule comparisons will only be accurate when comparing schedules of providers with the same scheduling format.
Prioritize a Harmonious Schedule: Some scheduling decisions related to blocks, forced appointments, and wave scheduling will affect the output of this report. If your current setup works well for your providers and daily workflows but not for reporting, PCC encourages you to prioritize your providers’ schedules, and happiness, over reporting details.
Run the Provider Schedule Utilization Report
Within each provider’s templated schedule, how much time is filled, kept, and missed?
The Provider Schedule Utilization report compares your scheduling templates with the Appointment Book history to get the “fill rate” for each provider.
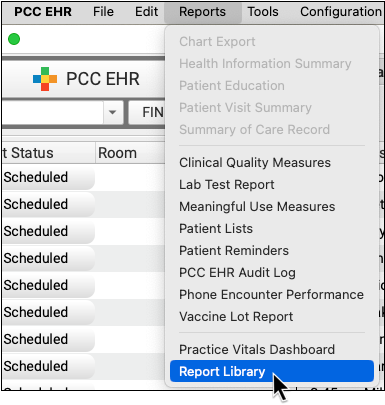
Open Report Library
Open the Report Library from the Reports menu in PCC EHR.
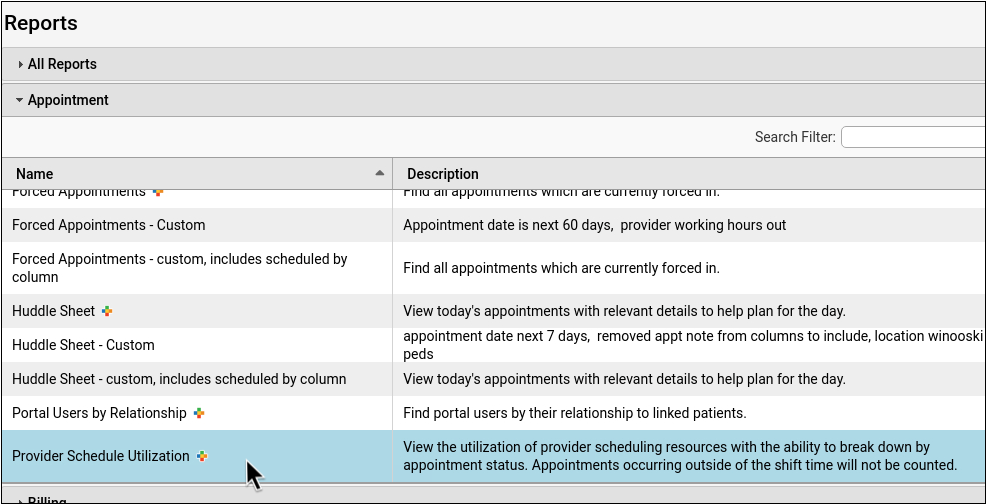
Open the Provider Schedule Utilization Report
Click on the Provider Schedule Utilization row to open the report.
Customize the Report
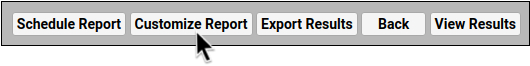
To access the list of all customization options, click “Customize Report” on the criteria Screen.
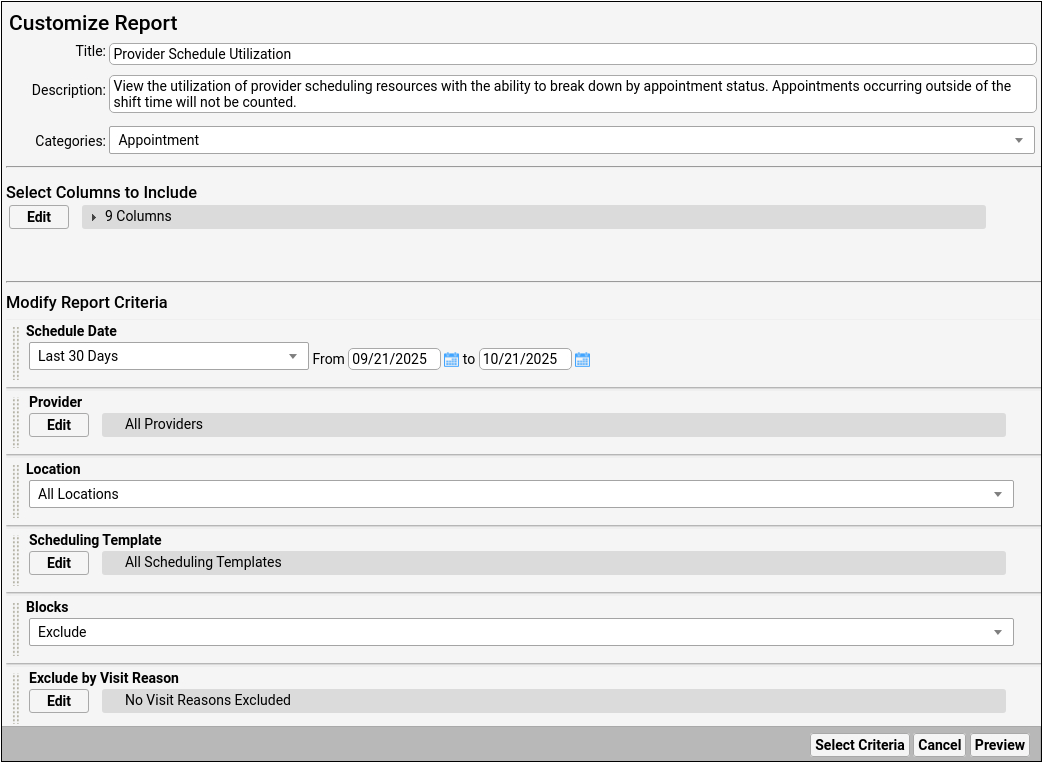
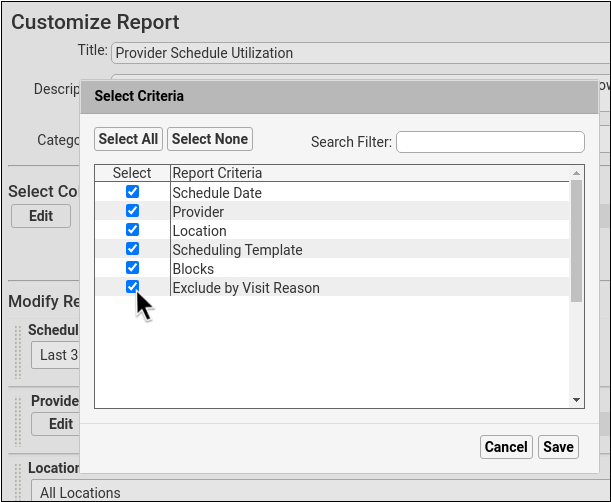
Select Criteria Options
Use the “Select Criteria” button to add or remove criteria from a report.

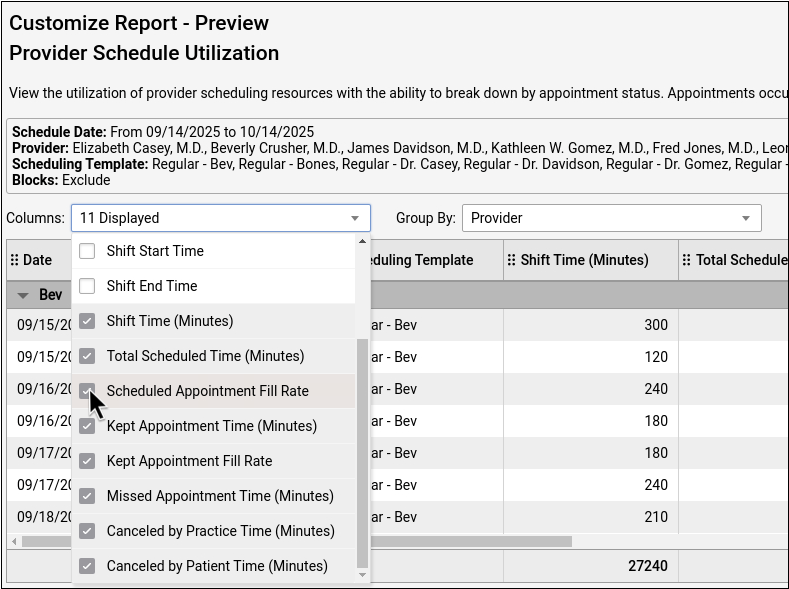
Select Columns to Include
Click the “Edit” button under “Select Columns to Include”, then choose which columns to include in the report.
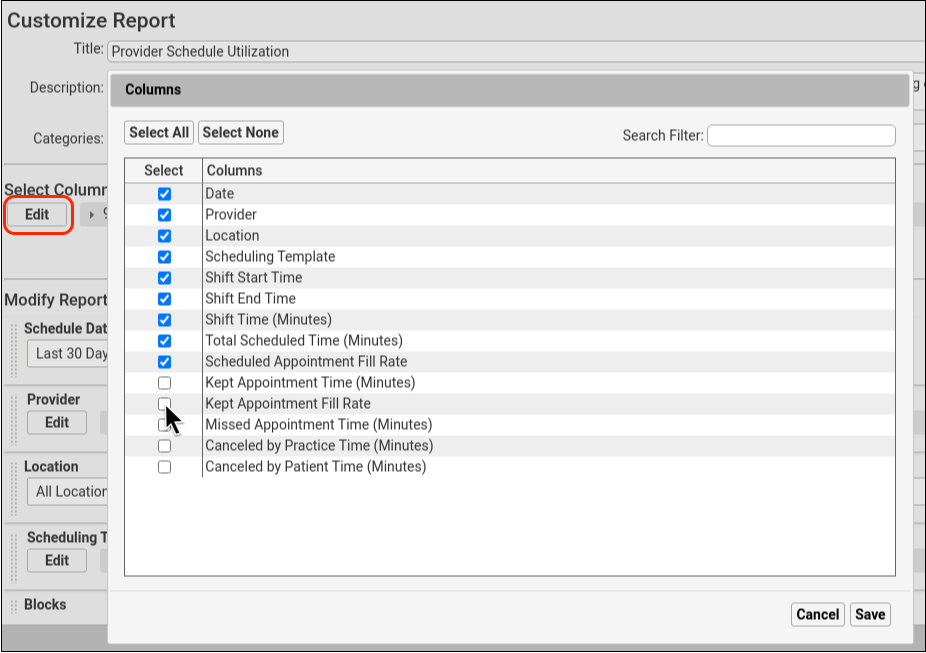
Results will display as an aggregate number. A few of the more complex column options are:
Kept Appointment Time: Kept Appointment Time is the total minute duration of all appointments for a template shift that were not canceled. This includes any appointments that are on the Schedule screen.
Kept Appointment Fill Rate: Kept Appointment Fill Rate is the percentage of kept appointments compared to the shift time duration.
Total Scheduled Time: This is the sum of scheduled kept appointments plus scheduled missed appointments that were not canceled. Total scheduled minutes will show a higher value than kept, as kept appointments do not include missed appointments.
Appointments canceled by the practice, or by the patient, are not included in the total scheduled time.
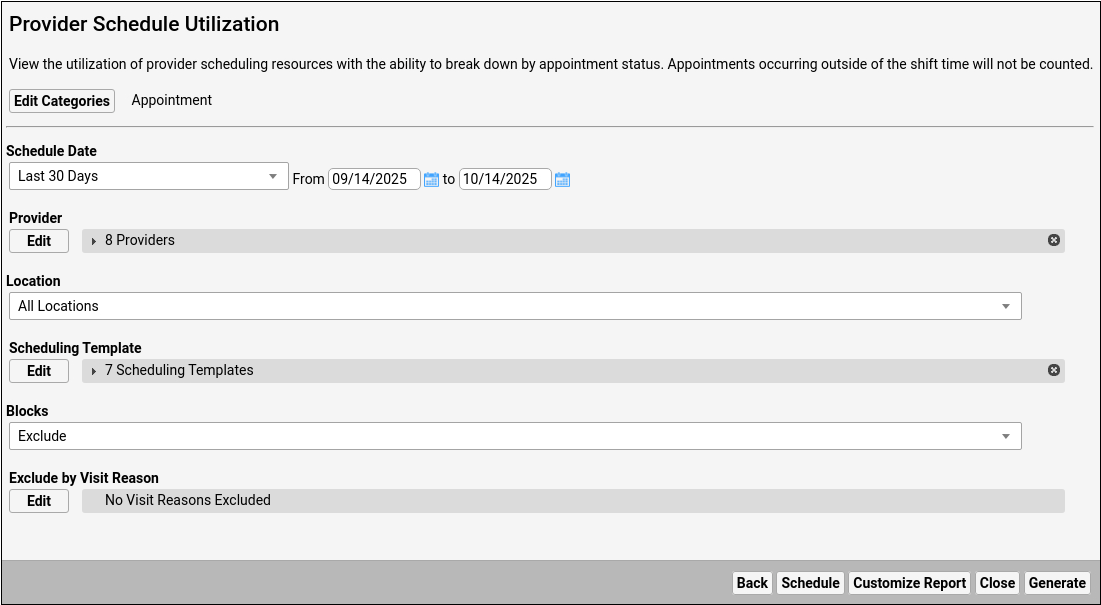
Modify Report Criteria
Pick your desired date range and other criteria.
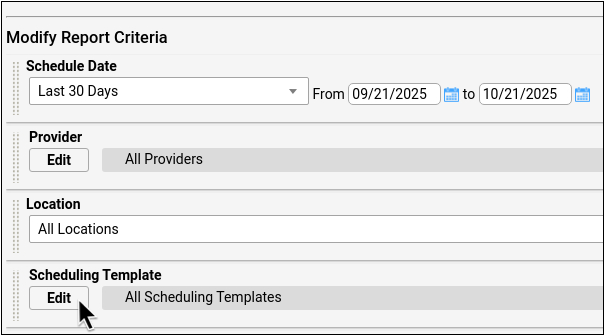
Your criteria settings will vary based on what you’re trying to accomplish with this report. The following is a list of default criteria:
Date Range: Pick schedule dates for the time frame that you want to look at.
Provider: If you’re looking for an understanding of how busy one provider is compared to another, choose the providers you want to review. You may wish to deselect catch-all providers, such as Flu Clinic or Phone Triage.
Location: If your practice has multiple locations, select the locations that you want to see in the report output.
Scheduling Template: The scheduling template is set in the Scheduling Template tab of the Provider Hours tool and holds all painted areas on your appointment book screen. Your providers may have several custom templates with variations of sick vs. well visits that are based on the time of year, day of the week, or other factors. You can include all templates in this report for a bigger picture, or choose specific templates to focus on.
Blocks: Blocks are generally used to prevent scheduling in a templated area, and are an important consideration for this report. The default setting is to exclude blocks in this report, as blocks do not generally indicate time off (unscheduled time). Whether or not to include blocks is based on how your practice uses and interprets blocked time.
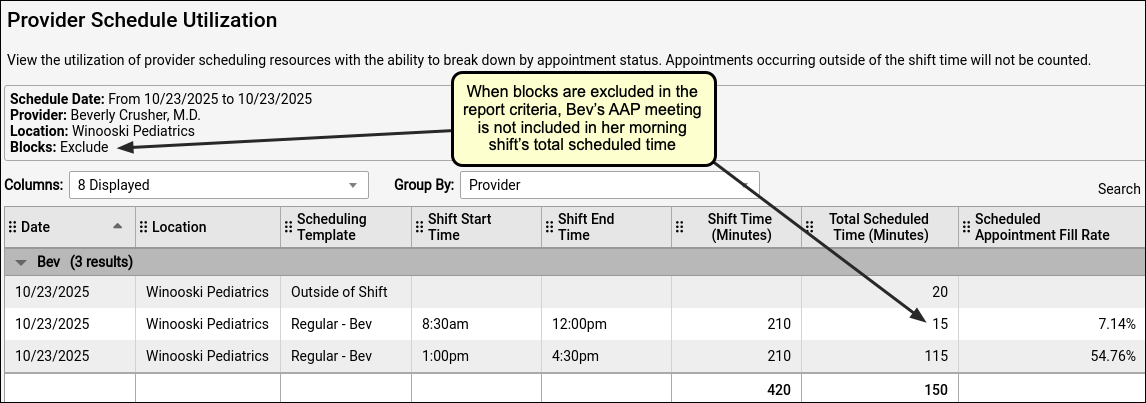
If you stick with the default and exclude blocks on your report output, blocked time will not be counted in the total scheduled time, and the provider may appear more available than they actually were.
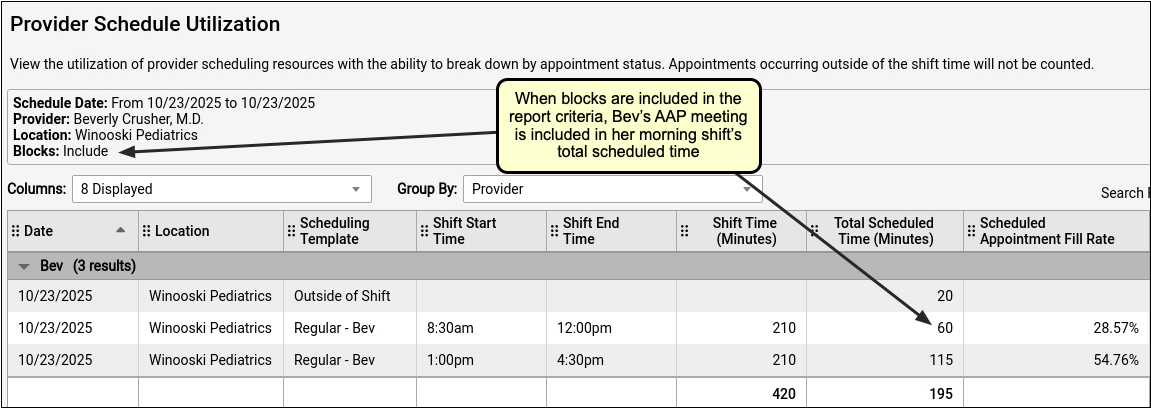
If you choose to include blocks, blocked time will be counted as equivalent to an appointment in the total scheduled time. That is, your report will show the amount of time that the provider had something on their shift schedule and was therefore not available to see patients.
Visit Reason: To report on sick vs. well, or other custom visit reasons, include or exclude visit reasons of your choice.
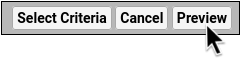
Preview the Report
Click “Preview” to see your report output.
Review and Adjust the Report Output
As you review report results, you can choose which columns to display. You can also sort and arrange results.
The way you customize your schedule will influence the way that this report returns results. For example, templates with many shifts during a given day will display more rows per day. If your practice regularly forces appointments, you will be more likely to see appointment minutes that are outside of the shift duration.
To learn how to adjust your report output, read Adjust Report Output.
Who Missed These Appointments?: This report provides an aggregate number of missed appointments. If a patient “no shows,” their appointment is typically marked as “Missed” by the practice. To take a deeper look at specific missed and canceled appointments, check out the Report on Missed and Canceled Appointments article.
Save Your Custom Report
Click “Save As” to make final adjustments to the report title and description. Then click “Save”.
Interpret the Default Provider Schedule Utilization Report
Why are there multiple lines for the same day for each provider? Which schedule elements count toward the Appointment Fill Rate?
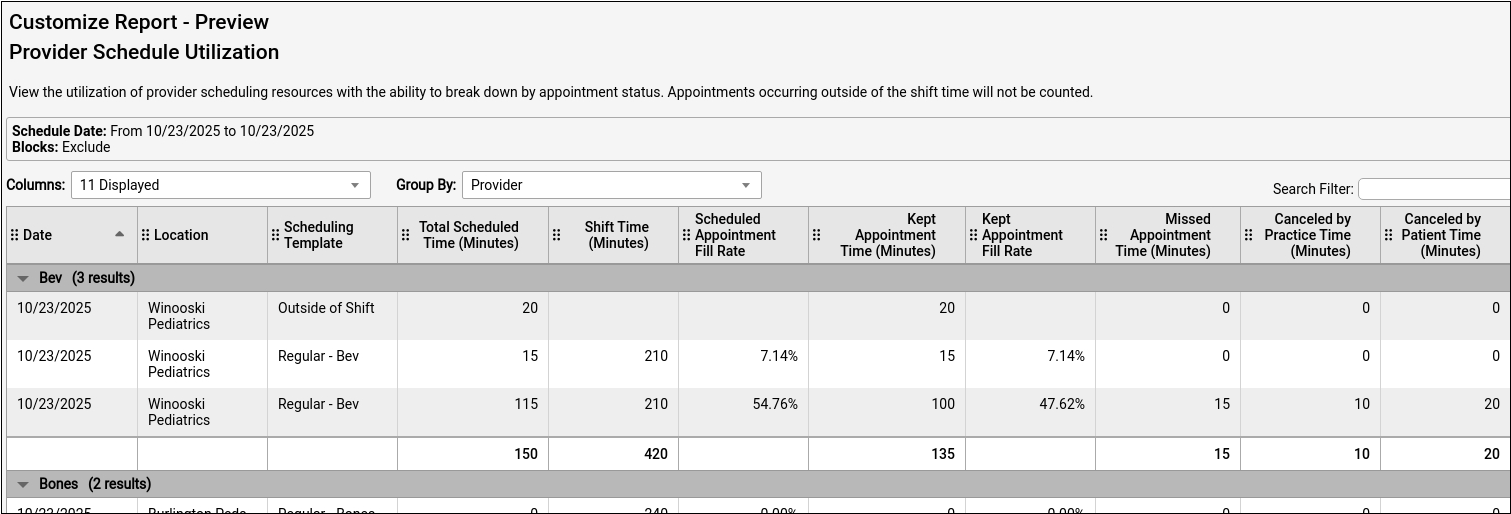
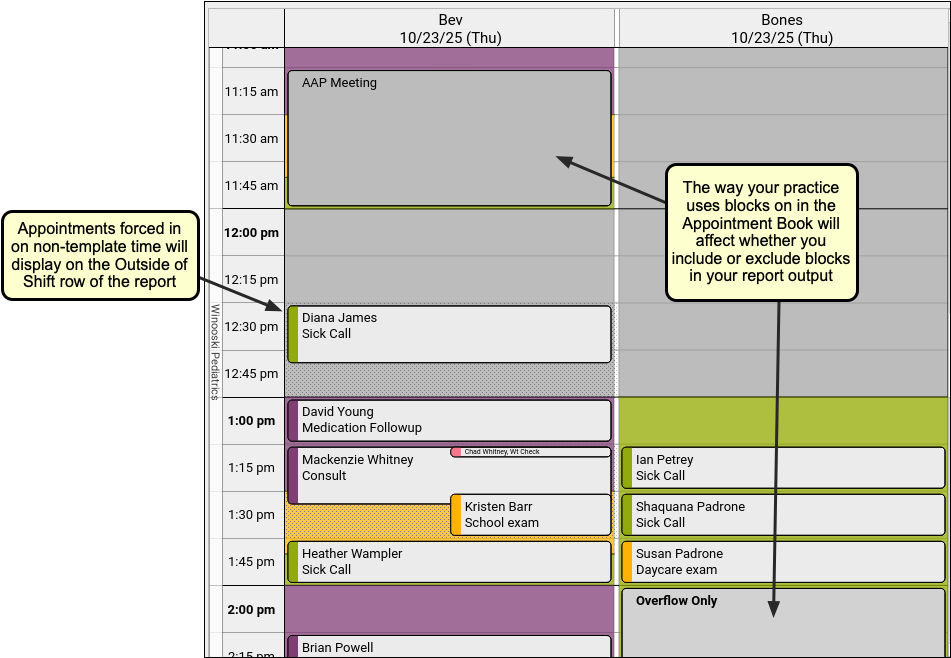
In the example below, Bev has a meeting with the AAP during her morning shift, and her afternoon includes a variety of patients and some available appointment slots. Bev also has one patient whose appointment during non-shift (non-template) time. This is an Outside of Shift appointment.
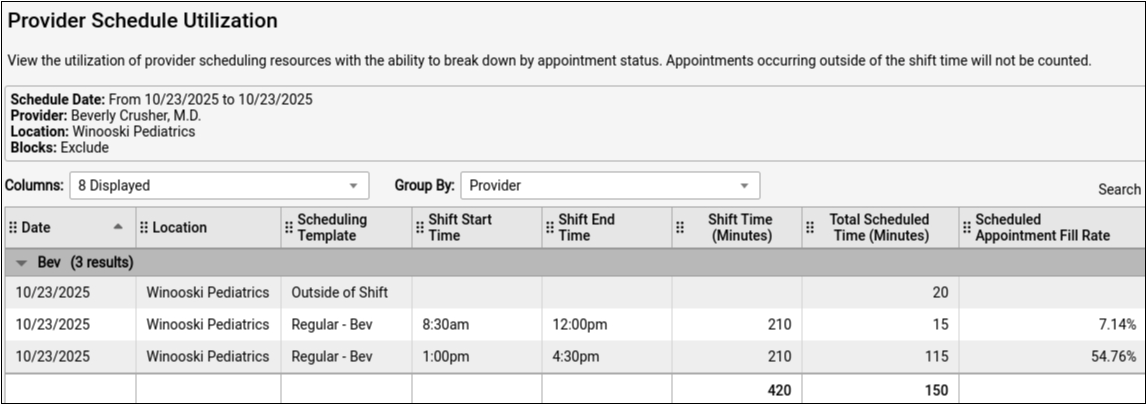
If you run the default report and limit it to only display Bev’s schedule for the day in the example schedule above, your report output will look like the example report output below.
You can use the explanations below to make sense of this report for Bev’s example schedule.
Schedule Date Range
For this example report, the date range is the single example day. You can set custom dates or pick a preset range from the Schedule Date drop-down in the Criteria page, which is the first page that you see when you open the report.
In this example, there are three rows for today because Bev had a morning shift, an afternoon shift, and an outside-of-shift appointment on her lunch break.
Location
The location in this example report is the one location selected on Bev’s example schedule. You can change the locations that display on your report by using the drop-down on the Criteria page, which is the first page that you see when you open the report.
Scheduling Template
If your practice has seasonal templates or templates with specific names, these template names will display in the Scheduling Template column of the report.
Outside of shift: In the example above, the forced 12:30 p.m. appointment is accounted for in the Outside of Shift row on the example report. The Outside of Shift row is only present in the report output when appointments were scheduled in the “off time” between template shifts during the selected date range. So, if we ran this same report for Bones’ schedule in the example above, there would not be an Outside of Shift row on his version of this report.
Note: There is no Fill Rate or Kept Appointments calculation for appointments that are scheduled outside of the provider’s template shift. The Outside of Shift row displays the total for time scheduled outside of the shift, so there is no template to fill. The Outside of Shift row does not track whether appointments that were scheduled outside of the shift were missed appointments.
Shift Start Time and Shift End Time
The other rows under Bev’s collapsible section of this report represent the template schedule for Bev’s morning shift (8:30 a.m.–12:00 p.m.), and afternoon shift (1:00–4:30 p.m.) If this report were for multiple days, each shift would have its own row in the report. Templates with many breaks between shifts will display a row for each shift, and the corresponding start and stop time for each.
Shift Time (Minutes)
The Shift Time column calculates the minutes of available (schedulable) time in a shift. In this example, Bev’s shifts are 3 hours and 30 minutes long, so her total shift minutes is equal to 210 minutes, and total shift time in the day is equal to 420 minutes.
Scheduled Appointment Fill Rate
The Scheduled Appointment Fill Rate is a calculation of the percentage of each shift that was filled with kept appointments. This is calculated using the Shift Time (Minutes) and the Total Scheduled Time. Note that, as shown in the examples above, this calculation will change based on whether or not blocks are included.
Total Scheduled Time (Minutes)
Total Scheduled Time is the sum of all kept and missed appointments and blocks that were scheduled during a shift. To express it a different way,
Total Scheduled Appointments = Appointments + Blocks
Blocks Excluded: When blocks are excluded, as shown in the example report below, the total scheduled time does not count blocks and only counts appointments. In the example report below, Bev’s morning shift consists of one 15 minute appointment, and her 45 minute AAP meeting was not counted as scheduled (filled) time on the schedule.
When blocks are excluded, Total Scheduled Time = x Appointment minutes + 0 Block minutes
Blocks Included: When blocks are included, as shown in the example report below, the total blocked time and total scheduled time are counted in the Total Scheduled Time column. In the example below, with blocks included, Bev’s 15 minute morning appointment and her 45 minute AAP meeting are both counted as scheduled time on the report.
When blocks are included, Total Scheduled Time = x Appointment minutes + y Block minutes
Should We Include or Exclude Blocks: Each practice, and sometimes each provider, uses and interprets blocks in their own way. In general, blocks act like appointments in that they use up available schedule time. But, in the example schedule, Bev used blocks for a work meeting, and Bones used blocks to keep his schedule organized. Each practice will need to consider whether they want to include Bev’s meeting or Bones’ overflow management blocks as available shift time that could have been scheduled, or as time that was scheduled and was therefore not available for further scheduling.
Suggested Uses of the Provider Schedule Utilization Report
This report helps practice managers know whether they are using their resources effectively. While there are many ways that you can use this report, here are a few to get you started.
Report on Totals
You can use this report to get a general sense of your providers’ schedule usage and then run it again with focus in a particular area.
Get an Overview: To get an overview of filled versus unfilled schedule time, run this report with only a few limiting criteria. This way you can understand the story of what is going on, and then drill down. Use the default report for your preferred date range, provider and locations, to get an overview of your schedule utilization.
Report on Totals for Specific Criteria: You can run this report to see totals per provider, per template, per visit reason, per shift (for time off/admin time). Run the default report for a specific date, or date range, to get totals for day, reason, template, and so on.
Add or Remove Columns for Further Aggregation: You can customize your report and add or remove columns for more aggregation of specific criteria. For example, try customizing your report to remove date, provider, and template columns. Your results will display aggregate minutes sorted by location, as pictured in the example below.


Report on Criteria by Location
Aggregate totals by location can help you get a picture of how busy each location actually is, and what kinds of appointments your providers are fielding.
Report on Visit Reason by Location: Want to know how many med checks are happening at one location as compared to another? Use the default report and group by location, then filter by visit reason to review your total visit reasons (med checks, sick visits, well visits, consults, or other visit reasons) distributed by location.
Report on Fill Rate by Location: If you have providers that work at various locations, are you wondering whether you need more staff at one location more than another? Is your smallest, farthest office too busy or not busy enough? Do you need to change your hours or your staffing at a specific location? Customize this report to include the kept visits and fill rates columns, then organize the report output by location and sort by provider.
Care Center Caution: Appointment time increments between care center locations do not always match. Cross-location comparison may not be appropriate for care centers when standard appointment times are shorter at one location as compared to another.
Report on Criteria by Provider
Want to find out what percentage of a provider’s day was filled? How can you know if you’re giving a new provider enough work? Are your providers always working more hours than their scheduled time?
Report Per Provider: To learn how your providers’ schedules are actually filling up, run the default report and filter it by provider to see each providers’ fill rate. You can isolate the appointments that were scheduled (forced) when the provider did not have schedule template hours by looking at the Outside of Shift row in the report output. This row displays in the report output if any appointments were scheduled outside of the scheduled template shift during the date range selected. Depending on your practice’s workflows, it may be expected—or unexpected—to book outside of your provider’s templated hours, so this row may or may not display frequently on your reports.
Report Across Providers: If some of your providers are busy and some are not, you can compare the fill rate across providers. Be sure to filter out fake providers and clinics by deselecting them on the criteria page, then run the default report and compare each provider’s totals for a quick evaluation of availability patterns and to see who can take more patients and who needs more time for charting. Knowing your providers’ fill rates will help you make decisions about scheduling practices, including whether to feed the provider new patients, or try to redistribute some of their panel.
Report on Criteria by Time of Day and Season
How many minutes were available for each provider last year as compared to this year? How many sick visits happen in the morning compared to the afternoon? How many sick visits should you plan for during the summer months as opposed to the winter? This report will give you output totals for various criteria for a specific date, or for a range of dates.
Report on Totals by Day and Season: This report allows you to look at totals for by day, visit reason, scheduling template, and more. Depending on your configuration, you may be able to do cross-evaluation between filters such as location, provider and visit reasons per quarter. If you want to find out when to switch to your school preparation or flu season template, run the default report for different periods of time to find seasonal patterns.
Report on Visit Reason and Other Filters by Time Period: Does your practice need to shift the templated ratio of sick and well visits for certain shifts? The Provider Schedule Utilization This report can give you the proportion of visit reasons for a period of time, with an aggregate total that can help you understand the volume of each visit reason (or other criteria) that your practice is fielding by day, or over a period of time.
Run the default report and choose specific criteria, such as visit reason, to find trends. To evaluate how much of the schedule is getting filled by a specific visit reason, such as ADHD med checks, limit by that specific visit reason on the Criteria page.
Depending on the level of detail in your practice’s configured visit reasons, you could compare the time-of-day distribution of sick vs. well, sick vs. urgent care, same day appointments vs. walk-ins, and so on. Run the report once for each visit reason, keeping other restrictions matching, then compare your results.
Assess a Scheduling Element
Are your current schedule templates working? Do you need to alter your templates to match what your fill rate actually looks like? Or do you need to change your workflow to more closely follow your provider’s schedule template?
Assess Templates: You can assess a template, blocks, visit reason, or other scheduling element by running the default report for a specific amount of time and closely observing the fill rate and other criteria during that template’s range. For example, if you have a regular template that is applied to each day of the week, you could look at your provider’s templates for each day to see which days of the week are under and over filled. Your practice will know best whether to adjust the template or the scheduling workflow based on what you discover.
If your practice’s templates have sick and well appointments painted into the template, you may wish to assess whether the volume of these visit types matches the volume in the template. This may change by season, by day, or by location. By looking at specific criteria, such as by comparing specific templates, you can narrow down trends that could be accommodated by a template or workflow shift. For example, if you want to know the proportion of sick visits in your winter templates versus summer templates, you could run the report for the winter template and run it again with the same criteria restrictions for the summer template and compare the results.
Assess Blocked Time: How much time is scheduled and blocked at your practice? Do certain providers use blocks more than others?
You can use the Provider Schedule Utilization report to find out how many blocks your providers are using over a period of time. Run the report twice, once with blocks included and once with blocks excluded (over the same period of time, with the same providers) to compare how much time was blocked for a specific provider. You could also run the report with blocks included but exclude all visit reasons to get the number of blocked minutes for a period of time.
Practices use blocks for a variety of purposes. Blocks are manually entered into the appointment book to block scheduling for a one-time event. For example, if you are holding a staff meeting, or your provider has a personal appointment, you can block that time on the schedule so that your staff will know to avoid scheduling your provider during that time. Regular off-time, or time when the provider is not expected to be seeing patients, should be configured into the template rather than blocked off manually.
Update Workflows
As seen above, this report can highlight places where the scheduling template needs to be updated. However, when the templates are accurate and blocking is judicious, but your provider fill rates do not align with the provider’ shifts, your practice may need to adjust the scheduling workflow and communicate with scheduling staff and providers.
For example, if a provider’s scheduled admin time is routinely overbooked with sick visits, the scheduling workflow needs to be improved so the provider can do their charting at the office, and not at home.
An updated workflow for this example could include:
- A more specific label on the schedule to indicate admin time
- A conversation with the provider to ensure that the template is accurate and their admin time should remain at that time of day in the template
- Raised awareness for all staff that admin time is not to be scheduled over
- An alternative strategy for the scheduling staff so that they know what to do with sick appointments that might overlap with the provider’s admin time.
Contact PCC Support: If you have a specific workflow or reporting question, PCC Support is here to help. We can walk you through how to make the most of your report findings, and assist you in making changes to your templates and workflows.