Review Individual Dashboard Measures
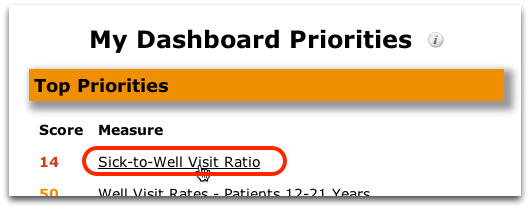
Click on any dashboard measure from your Practice Vitals Dashboard to see more details.
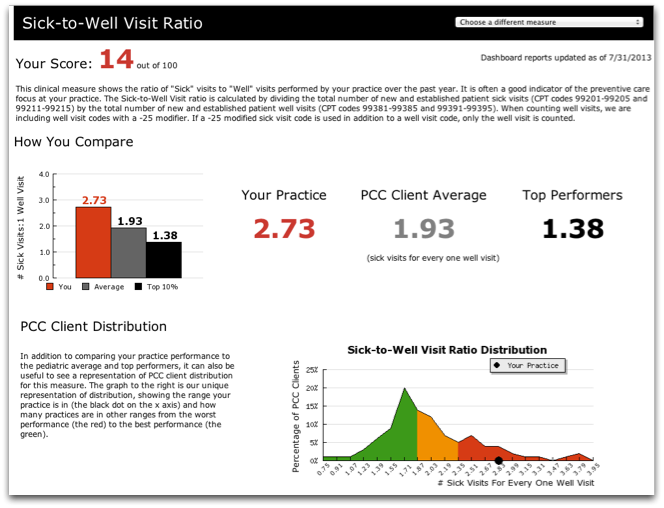
You’ll see an explanation of your score, comparison charts, trends, and recommendations.
From the top of each details page, you can use a pull-down menu to navigate to any other measure.
Most measures include the following sections:
-
Your Score, and Definition: Your score, and how that score is calculated.
-
How You Compare: Your averages compared to other PCC clients.
-
PCC Client Distribution: A distribution graph showing where your numbers are in context with other practices.
-
Trend: A history of your data over time.
-
Recommendations: What you can do to increase your score.
-
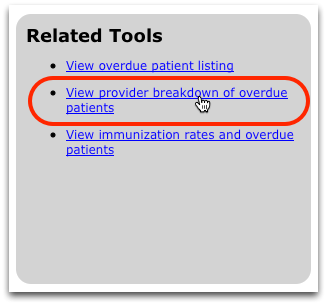
Related Tools: A list of links to other measures, patient lists, or reports that break the data down by provider or by vulnerable populations.
Detailed Breakdown
Scroll to the bottom of a measure and click on a Related Tools link to view a breakdown of the data.
After clicking on a link to review a breakdown of the data, you can sometimes select additional breakdown criteria.
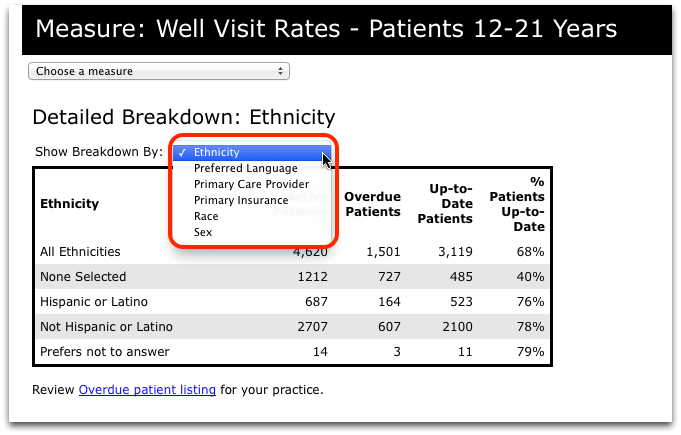
You can use this data to review measure results for each primary care physician, or review how your practice meets the measure for variety of vulnerable populations.
For example, you could review a Provider breakdown on the Sick-to-Well Visit Ratio measure.
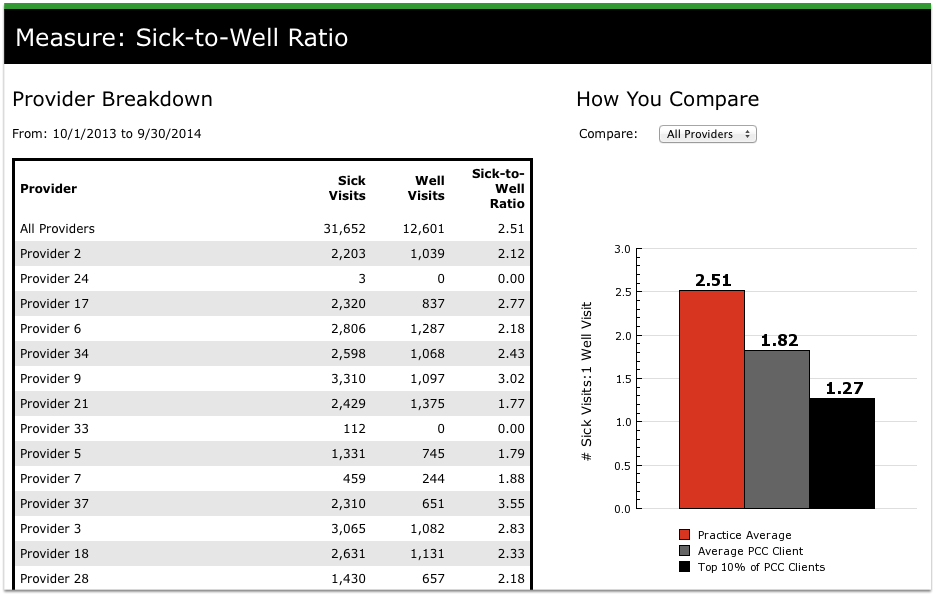
The Provider Breakdown of the Sick-to-Well Ration compares visit ratio for providers at your practice. You can use the Compare section to generate a bar chart for a specific provider.
Work With Merck: Another example use of the Detailed Breakdown tool is in the Immunization Rates – HPV measure. You can use the Age and Sex Breakdown Report to provide the necessary data for Merck’s “Health In Focus” rebate program.